Recent developments in Edinburgh regarding the growth of Airbnb and its impact on the housing market means a better understanding of the Airbnb listings is needed. Using data provided by Airbnb, we can explore how Airbnb availability and prices vary by neighborhood.
edibnbFormat
A tibble with 13,245 rows and 10 variables:
- id
ID number of the listing
- price
Price, in GBP, for one night stay
- neighborhood
neighborhood listing is located in
- accommodates
Number of people listing accommodates
- bathrooms
Number of bathrooms
- bedrooms
Number of bedrooms
- beds
Number of beds (which can be different than the number of bedrooms)
- review_scores_rating
Average rating of property
- number_of_reviews
Number of reviews
- listing_url
Listing URL
Source
https://www.kaggle.com/thoroc/edinburgh-inside-airbnb/version/2
Details
The data come from the Kaggle database, and was originally distributed by Inside Airbnb on 25 June 2019.
The data has been modified to better serve the goals of introductory data science education.
Examples
library(ggplot2)

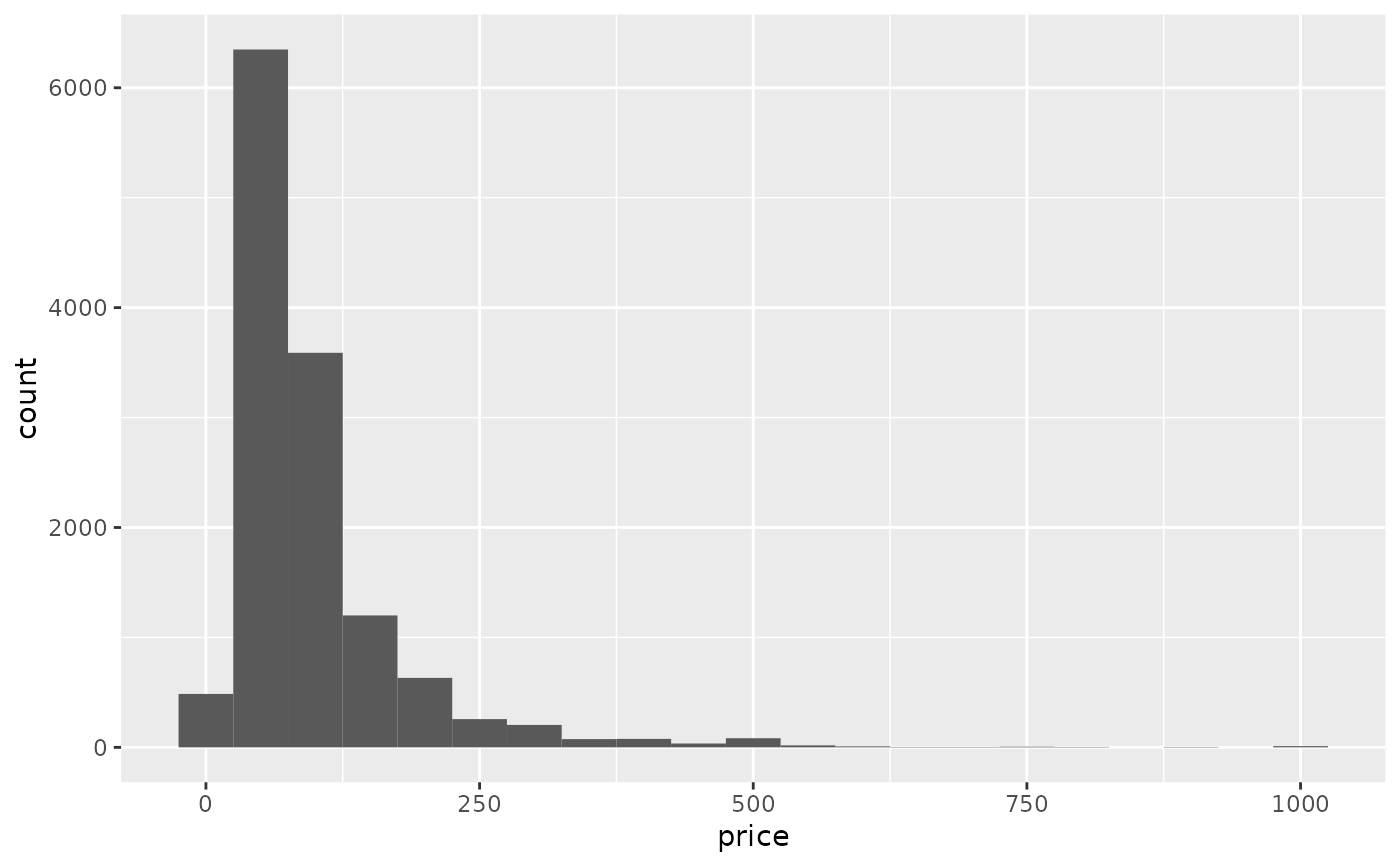
ggplot(edibnb, aes(x = price)) +
  geom_histogram(binwidth = 50)
#> Warning: Removed 199 rows containing non-finite values (`stat_bin()`).
