This is a special version of geom_raster() optimised for static
annotations that are the same in every panel. These annotations will not
affect scales (i.e. the x and y axes will not grow to cover the range
of the raster, and the raster must already have its own colours). This
is useful for adding bitmap images.
annotation_raster(raster, xmin, xmax, ymin, ymax, interpolate = FALSE)
Arguments
| raster | raster object to display |
|---|---|
| xmin, xmax | x location (in data coordinates) giving horizontal location of raster |
| ymin, ymax | y location (in data coordinates) giving vertical location of raster |
| interpolate | If |
Examples
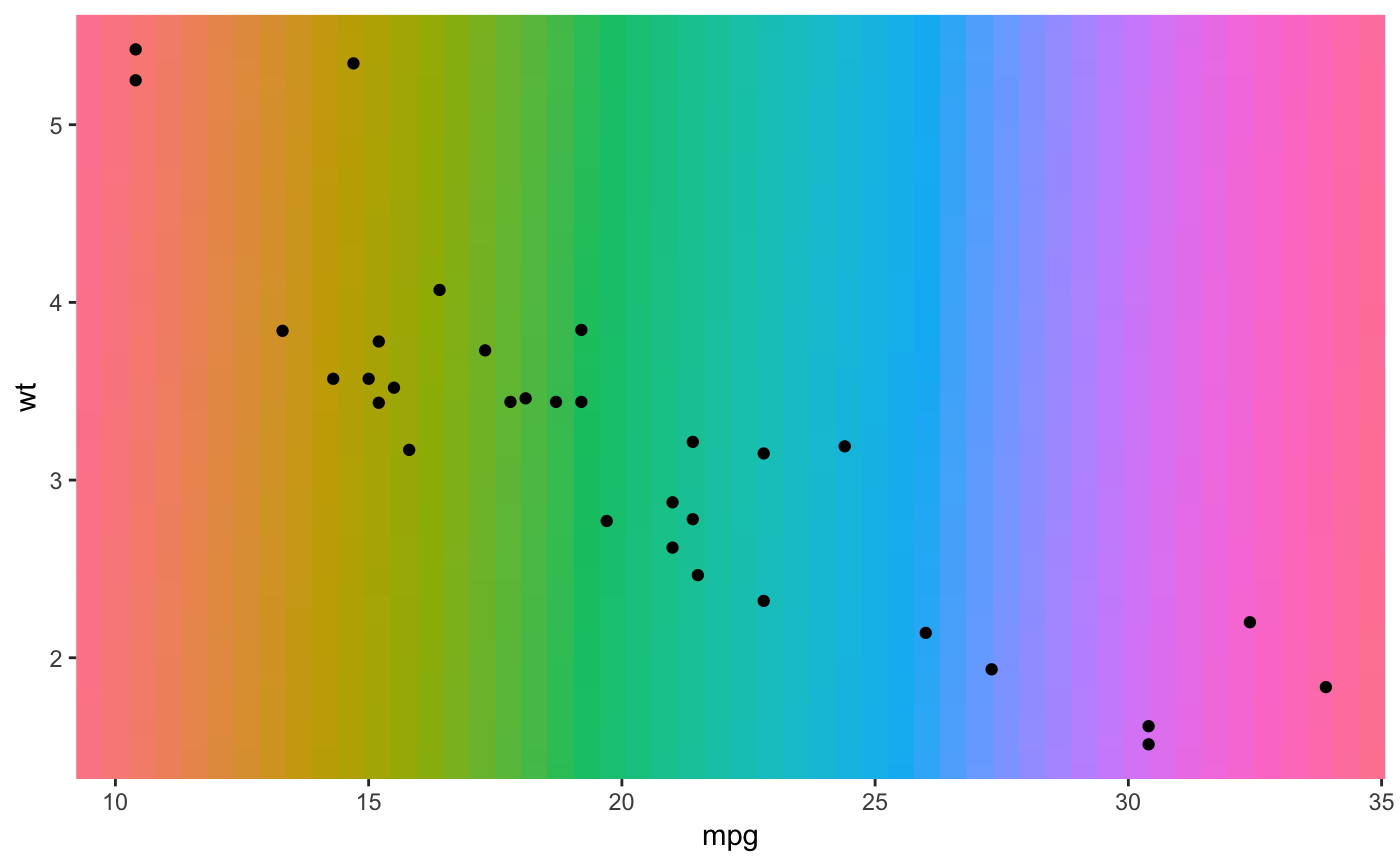
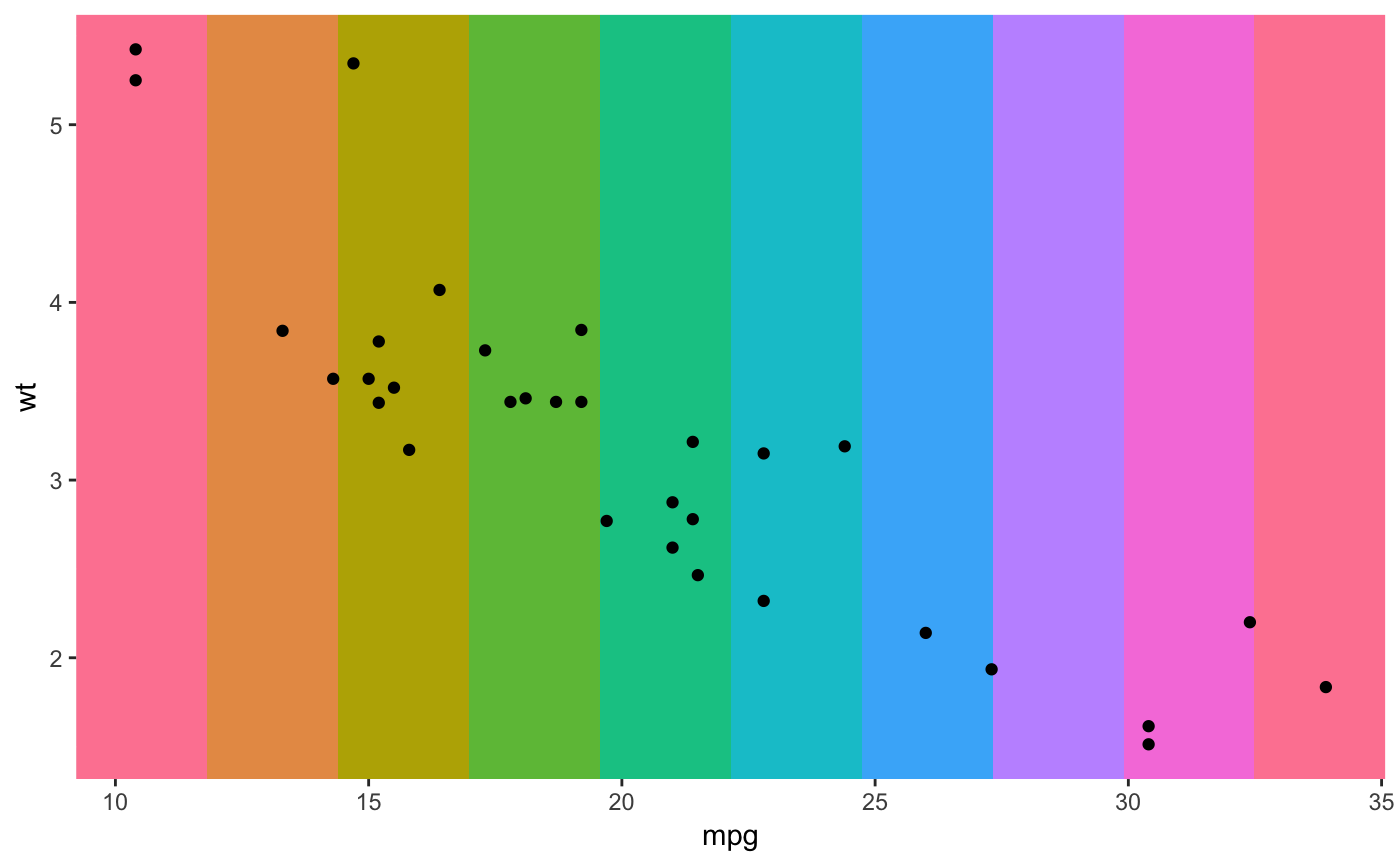
# Generate data rainbow <- matrix(hcl(seq(0, 360, length.out = 50 * 50), 80, 70), nrow = 50) ggplot(mtcars, aes(mpg, wt)) + geom_point() + annotation_raster(rainbow, 15, 20, 3, 4)# To fill up whole plot ggplot(mtcars, aes(mpg, wt)) + annotation_raster(rainbow, -Inf, Inf, -Inf, Inf) + geom_point()rainbow2 <- matrix(hcl(seq(0, 360, length.out = 10), 80, 70), nrow = 1) ggplot(mtcars, aes(mpg, wt)) + annotation_raster(rainbow2, -Inf, Inf, -Inf, Inf) + geom_point()rainbow2 <- matrix(hcl(seq(0, 360, length.out = 10), 80, 70), nrow = 1) ggplot(mtcars, aes(mpg, wt)) + annotation_raster(rainbow2, -Inf, Inf, -Inf, Inf, interpolate = TRUE) + geom_point()