Generally, you do not need to print or plot a ggplot2 plot explicitly: the
default top-level print method will do it for you. You will, however, need
to call print() explicitly if you want to draw a plot inside a
function or for loop.
# S3 method for ggplot
print(x, newpage = is.null(vp), vp = NULL, ...)

# S3 method for ggplot
plot(x, newpage = is.null(vp), vp = NULL, ...)
Arguments
| x | plot to display |
|---|---|
| newpage | draw new (empty) page first? |
| vp | viewport to draw plot in |
| ... | other arguments not used by this method |
Value
Invisibly returns the result of ggplot_build(), which
is a list with components that contain the plot itself, the data,
information about the scales, panels etc.
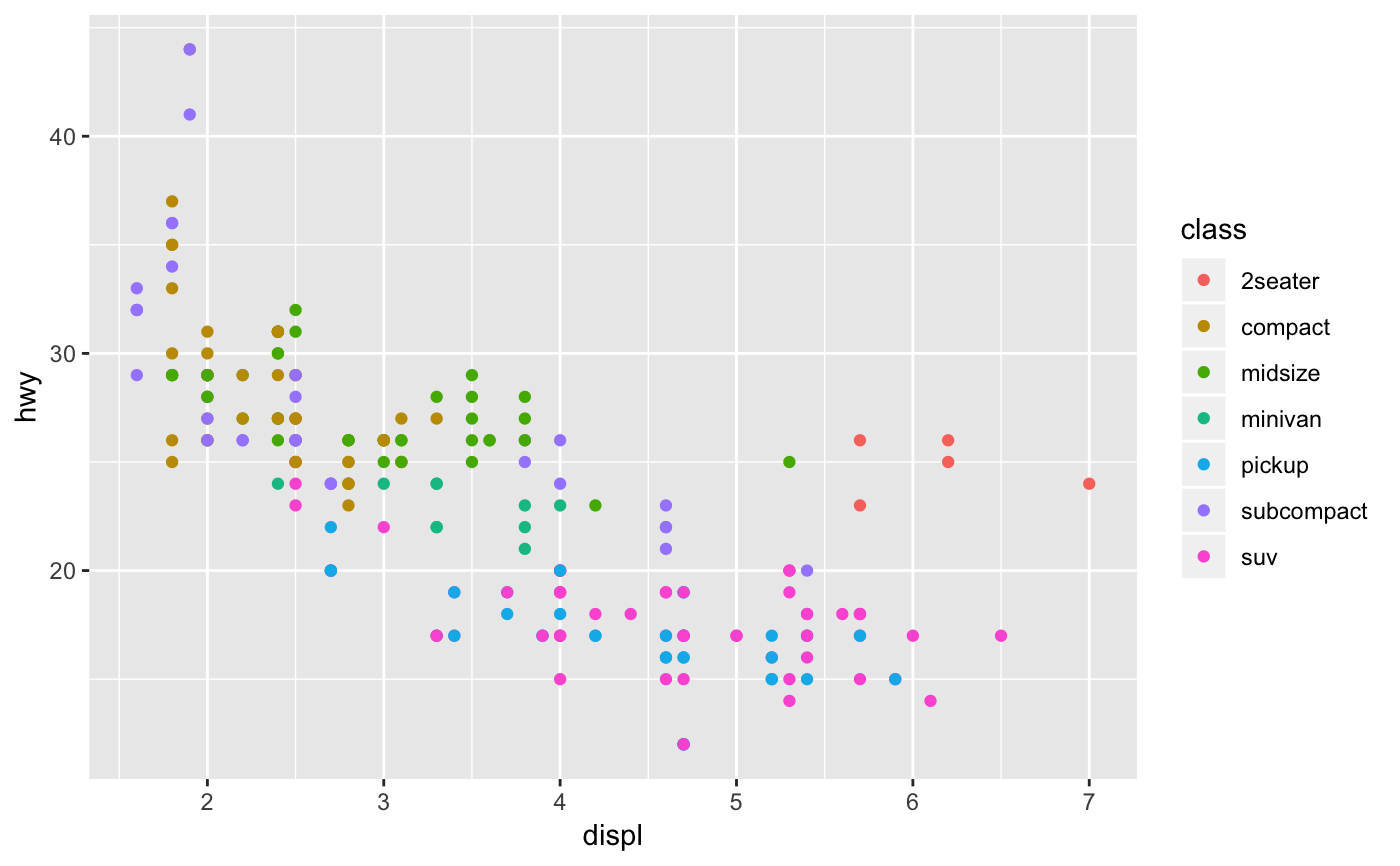
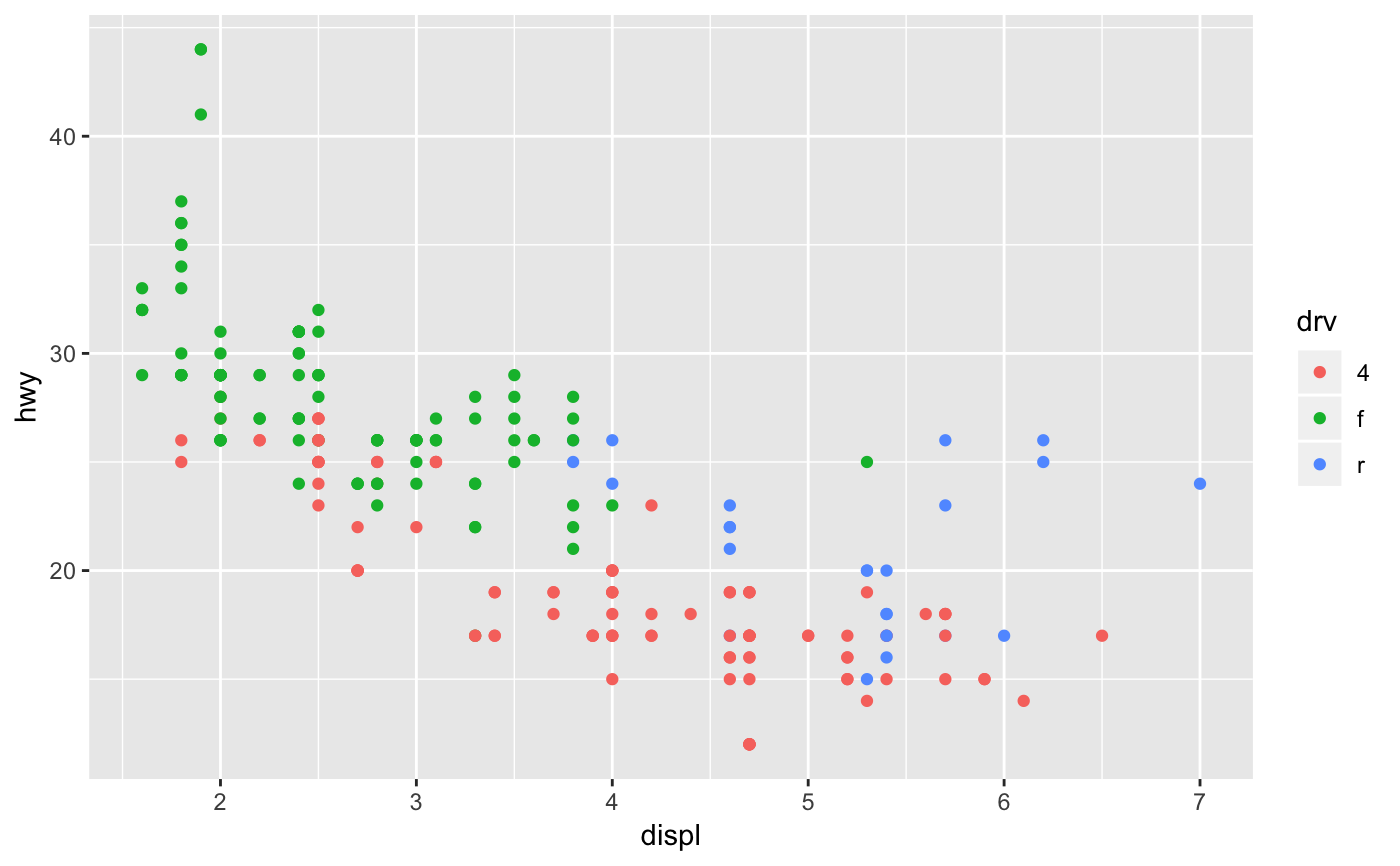
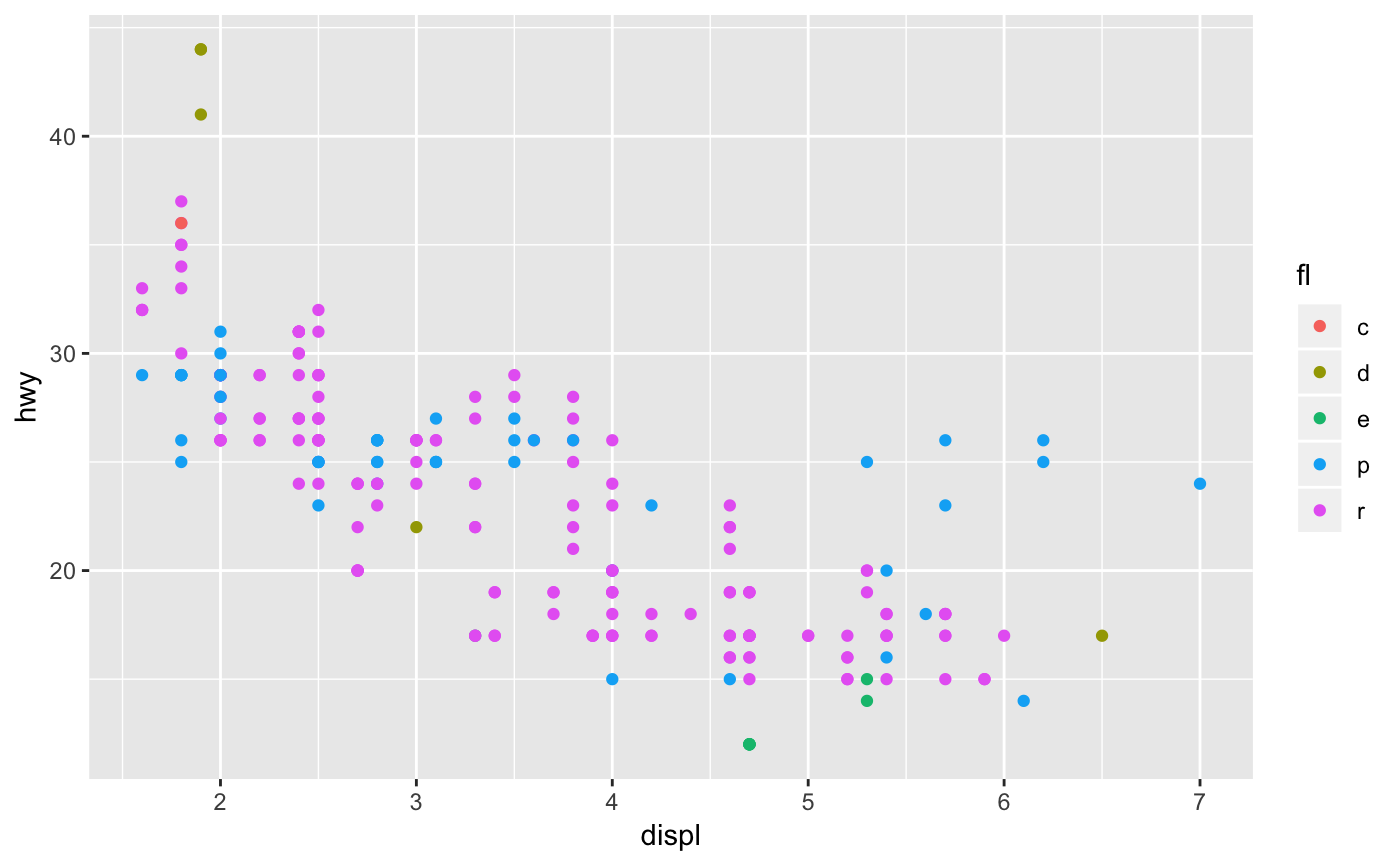
Examples
colours <- list(~class, ~drv, ~fl)

# Doesn't seem to do anything!
for (colour in colours) {
  ggplot(mpg, aes_(~ displ, ~ hwy, colour = colour)) +
    geom_point()
}

# Works when we explicitly print the plots
for (colour in colours) {
  print(ggplot(mpg, aes_(~ displ, ~ hwy, colour = colour)) +
    geom_point())
}