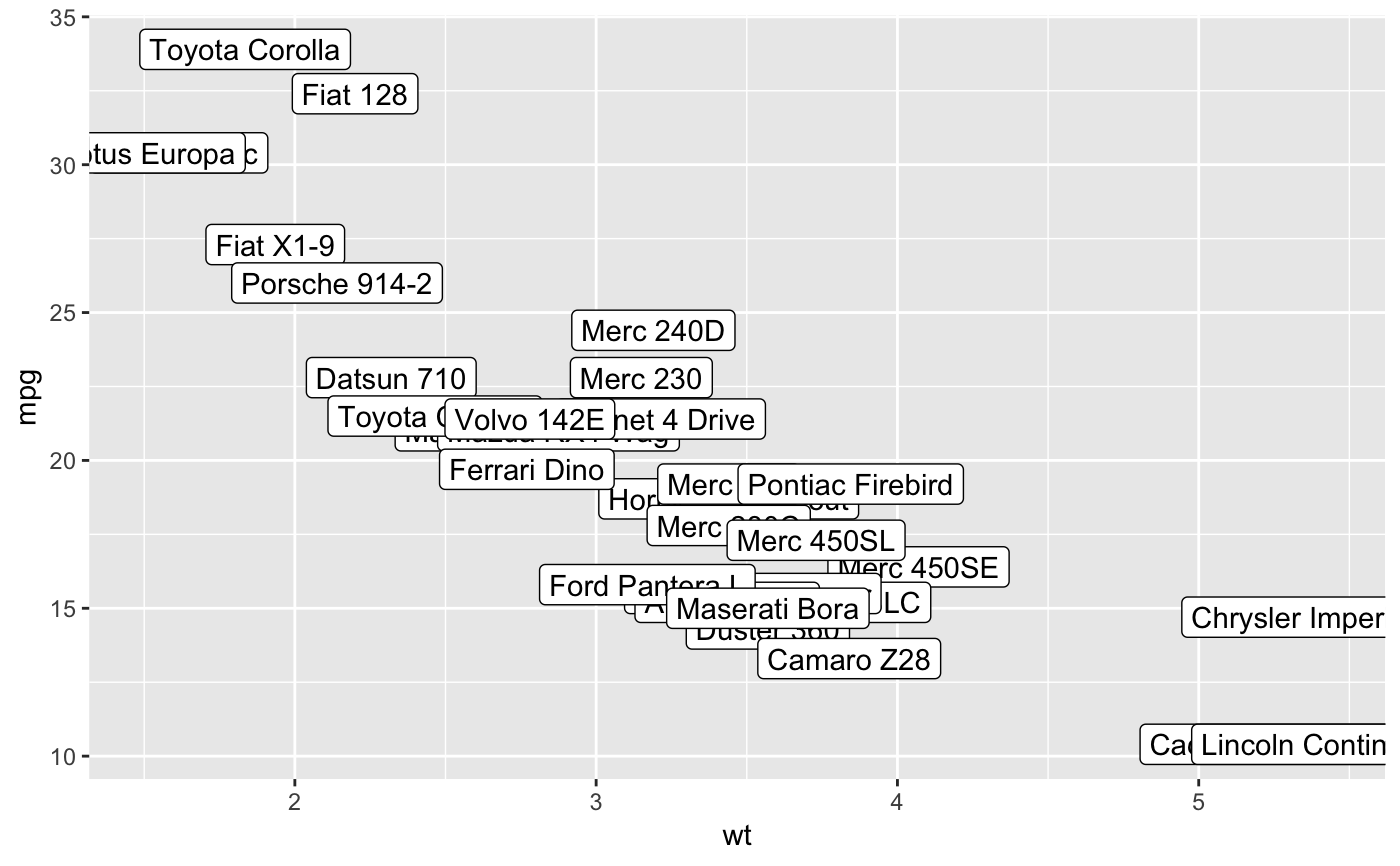
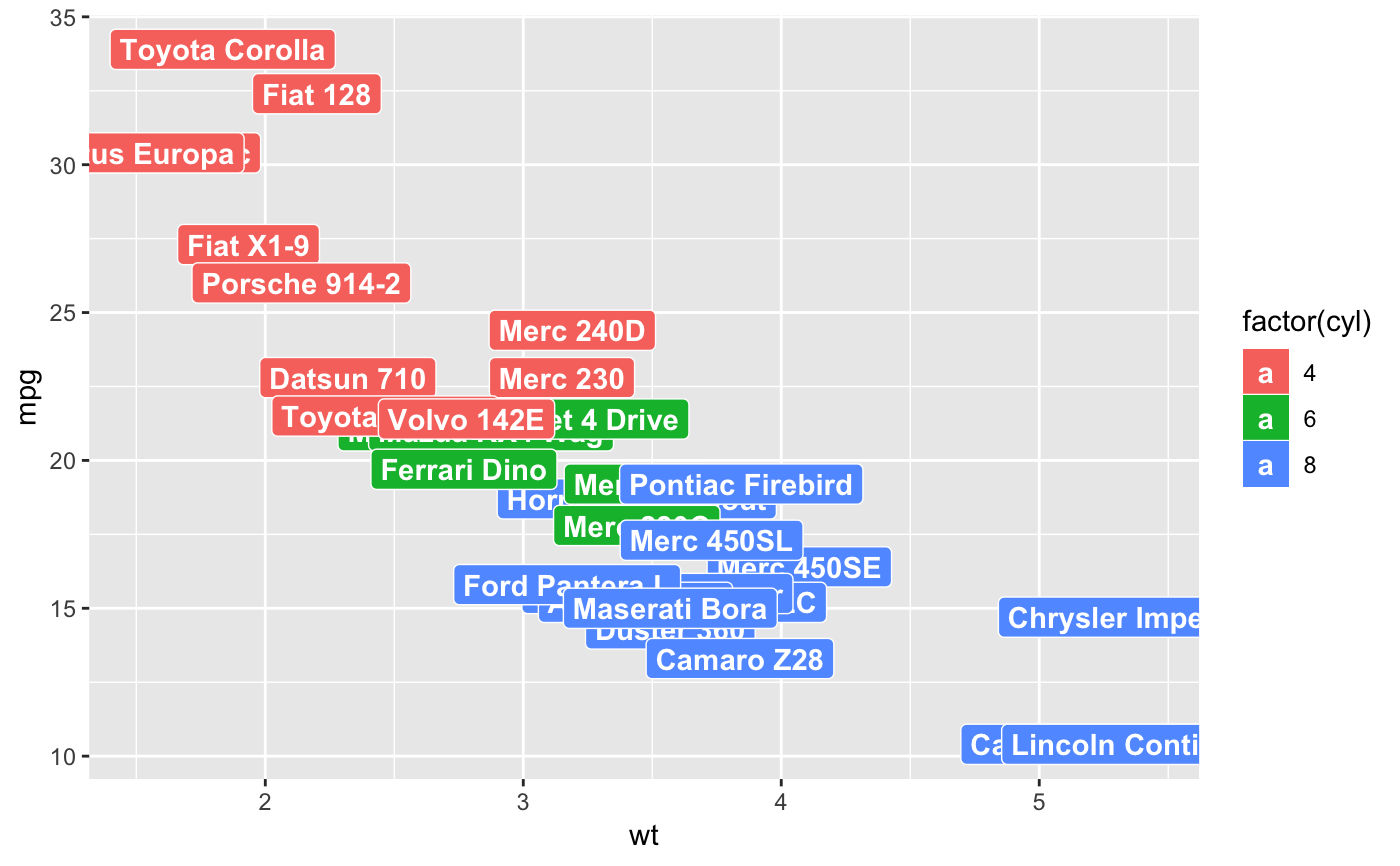
geom_text adds text directly to the plot. geom_label draws
a rectangle behind the text, making it easier to read.
geom_label(mapping = NULL, data = NULL, stat = "identity",
  position = "identity", ..., parse = FALSE, nudge_x = 0, nudge_y = 0,
  label.padding = unit(0.25, "lines"), label.r = unit(0.15, "lines"),
  label.size = 0.25, na.rm = FALSE, show.legend = NA,
  inherit.aes = TRUE)

geom_text(mapping = NULL, data = NULL, stat = "identity",
  position = "identity", ..., parse = FALSE, nudge_x = 0, nudge_y = 0,
  check_overlap = FALSE, na.rm = FALSE, show.legend = NA,
  inherit.aes = TRUE)
Arguments
| mapping | Set of aesthetic mappings created by |
|---|---|
| data | The data to be displayed in this layer. There are three options: If A A |
| stat | The statistical transformation to use on the data for this layer, as a string. |
| position | Position adjustment, either as a string, or the result of a call to a position adjustment function. |
| ... | Other arguments passed on to |
| parse | If |
| nudge_x, nudge_y | Horizontal and vertical adjustment to nudge labels by. Useful for offsetting text from points, particularly on discrete scales. |
| label.padding | Amount of padding around label. Defaults to 0.25 lines. |
| label.r | Radius of rounded corners. Defaults to 0.15 lines. |
| label.size | Size of label border, in mm. |
| na.rm | If |
| show.legend | logical. Should this layer be included in the legends?
|
| inherit.aes | If |
| check_overlap | If |
Details
Note that the "width" and "height" of a text element are 0, so stacking and dodging text will not work by default, and axis limits are not automatically expanded to include all text. Obviously, labels do have height and width, but they are physical units, not data units. The amount of space they occupy on the plot is not constant in data units: when you resize a plot, labels stay the same size, but the size of the axes changes.
geom_text and geom_label both add a label for each row in the
data, even if coordinates x, y are set to single values in the call
to geom_label or geom_text.
To add labels at specified points use annotate() with
annotate(geom = "text", ...) or annotate(geom = "label", ...)
Aesthetics
geom_text understands the following aesthetics (required aesthetics are in bold):
xylabelalphaanglecolourfamilyfontfacegrouphjustlineheightsizevjust
Learn more about setting these aesthetics in vignette("ggplot2-specs")
geom_label
Currently geom_label does not support the rot parameter and
is considerably slower than geom_text. The fill aesthetic
controls the background colour of the label.
Alignment
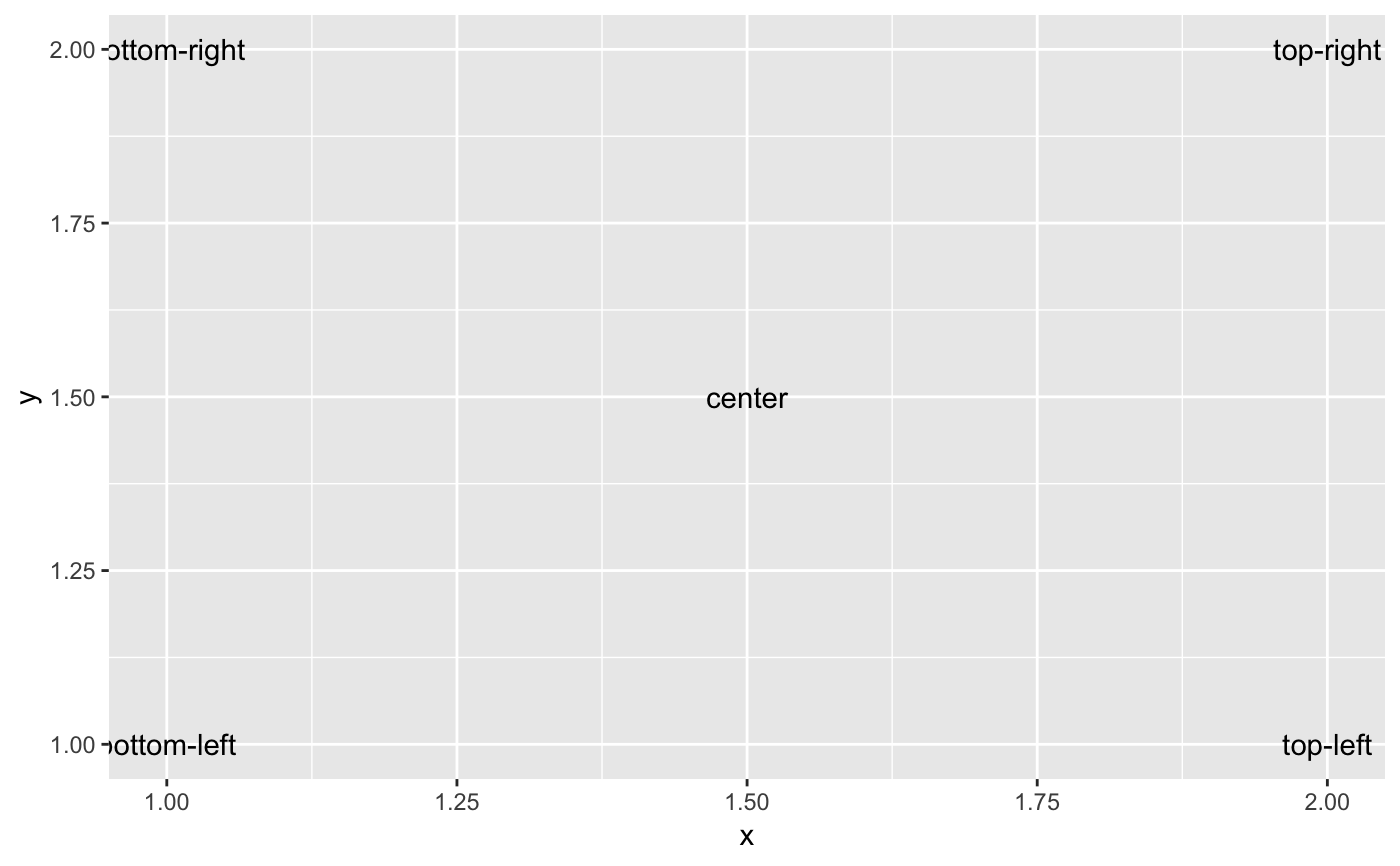
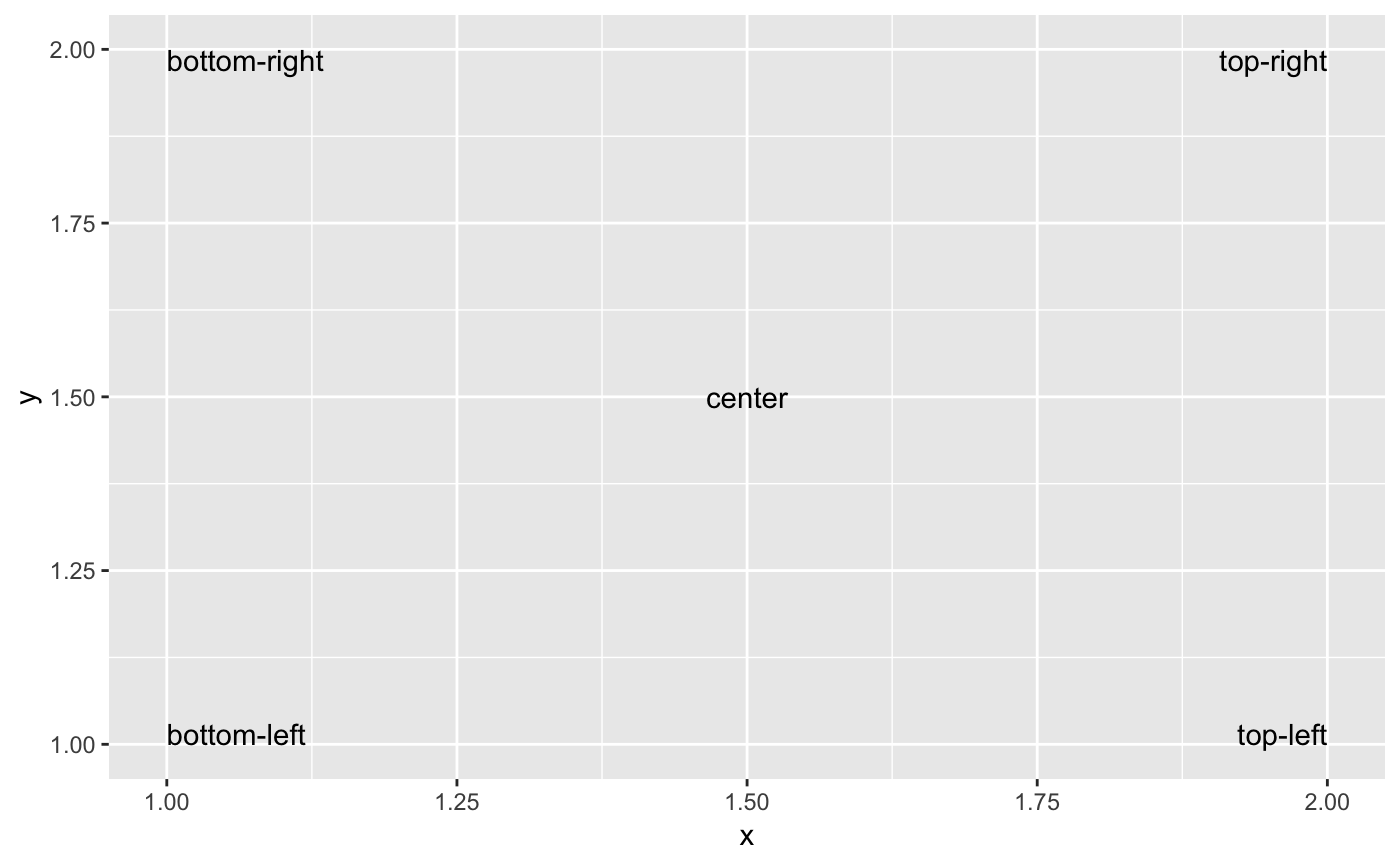
You can modify text alignment with the vjust and hjust
aesthetics. These can either be a number between 0 (right/bottom) and
1 (top/left) or a character ("left", "middle", "right", "bottom",
"center", "top"). There are two special alignments: "inward" and
"outward". Inward always aligns text towards the center, and outward
aligns it away from the center
Examples
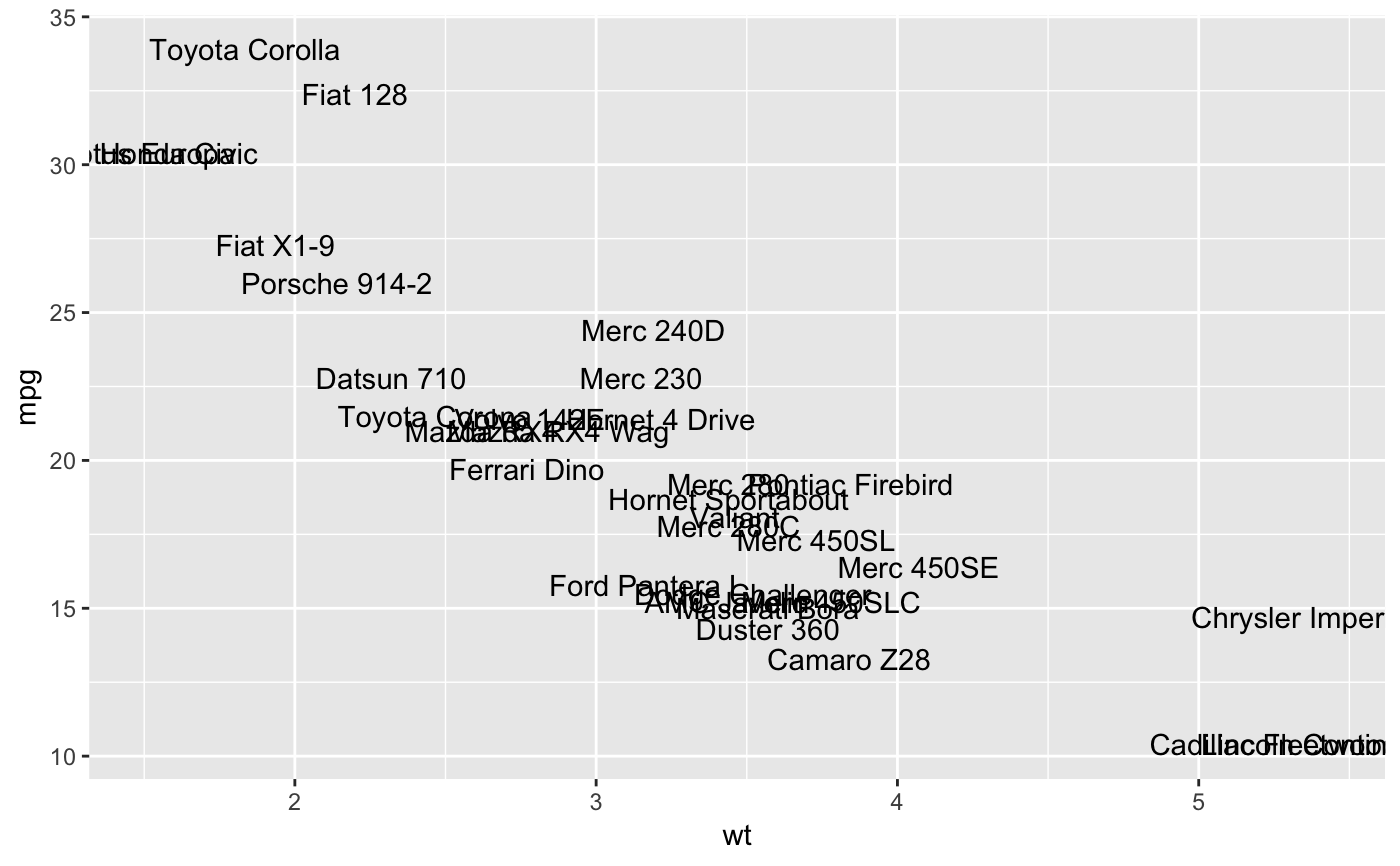
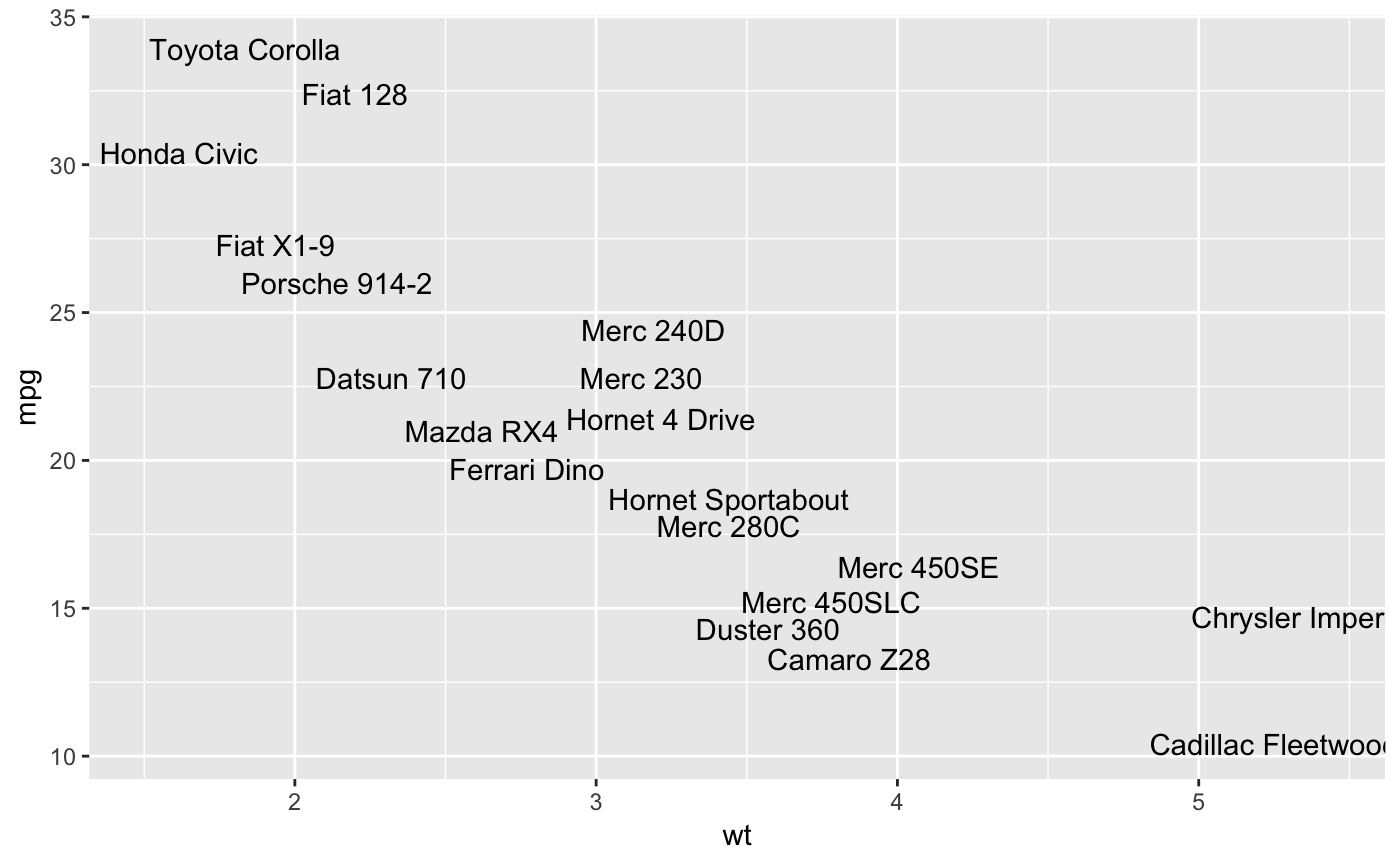
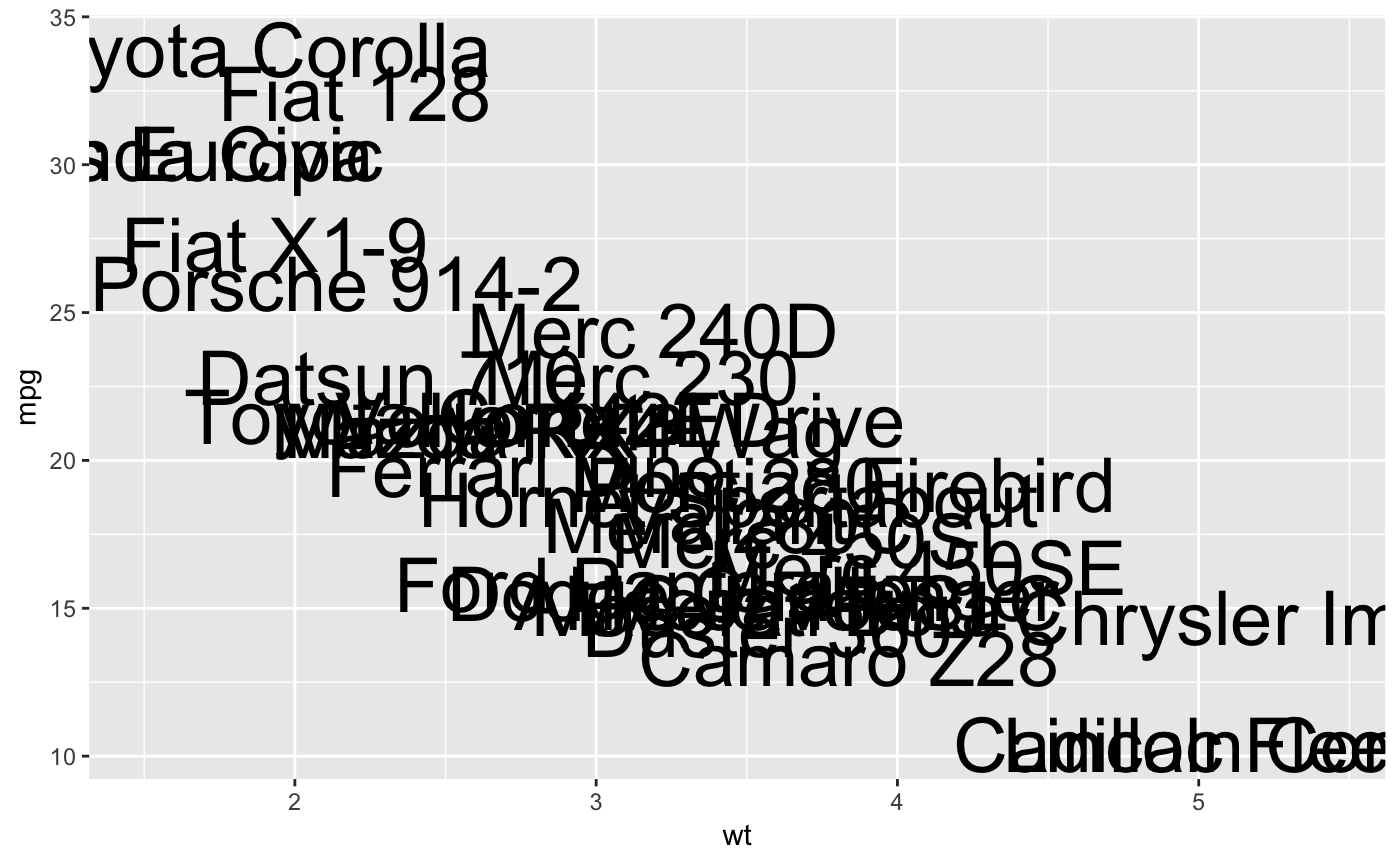
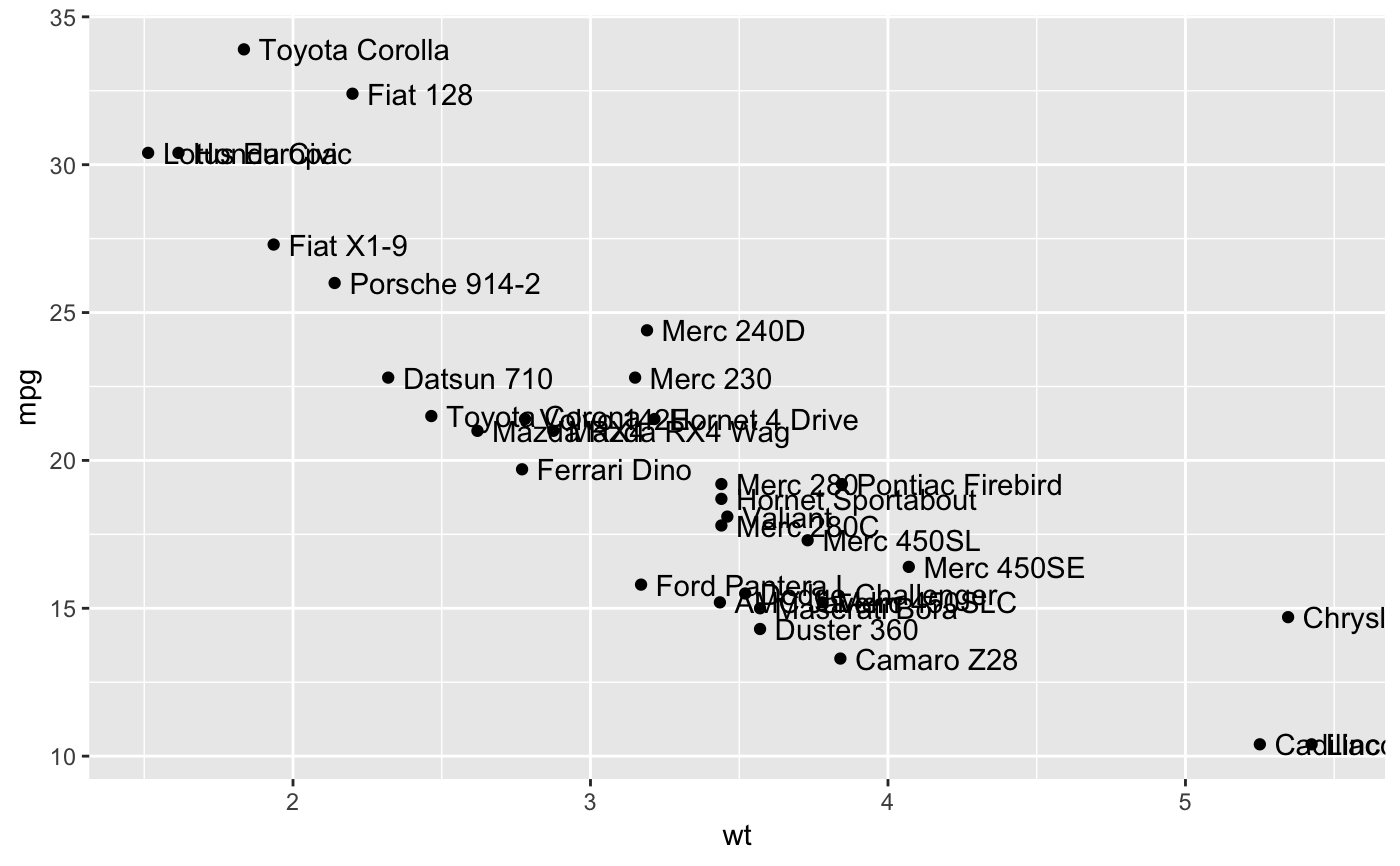
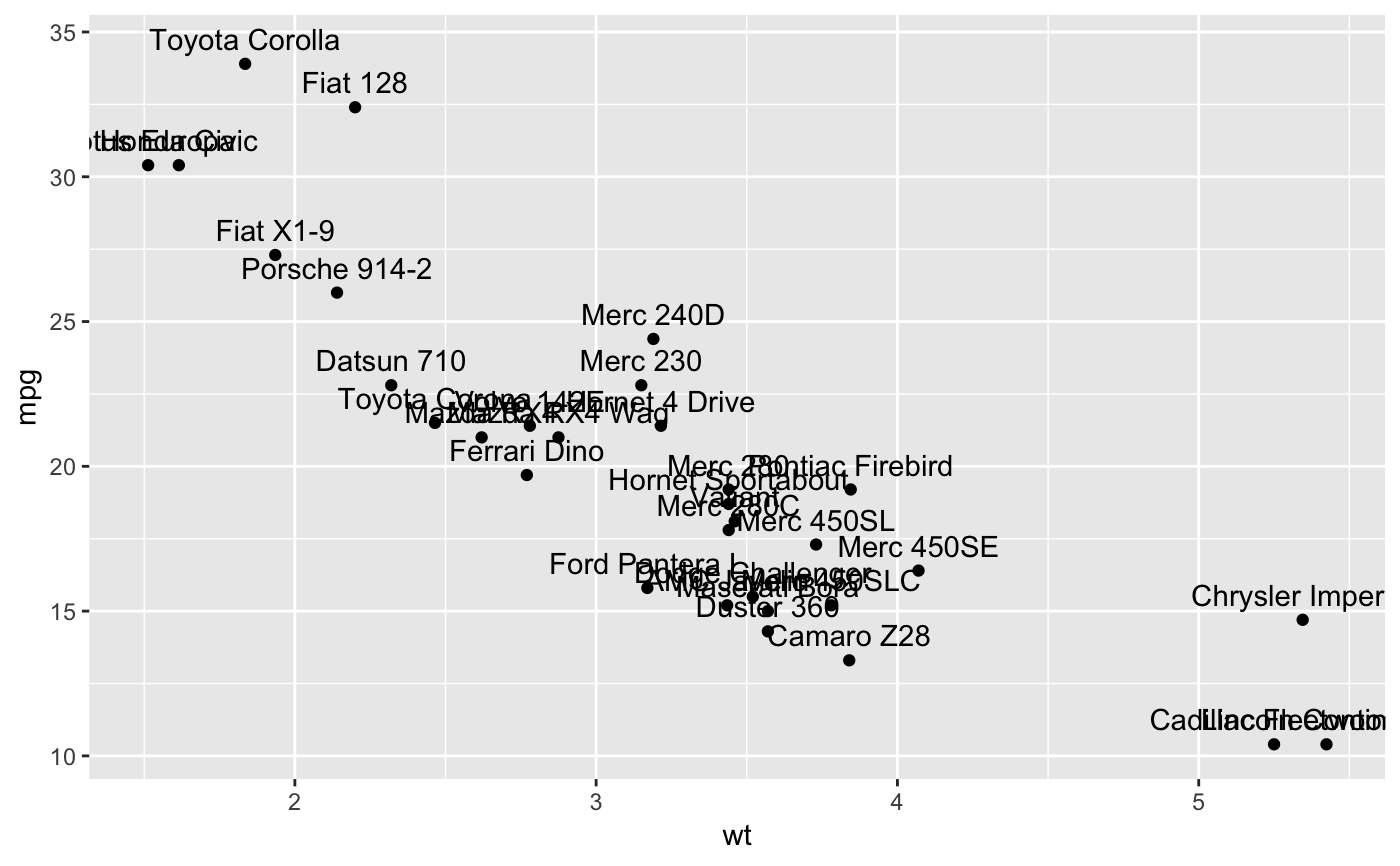
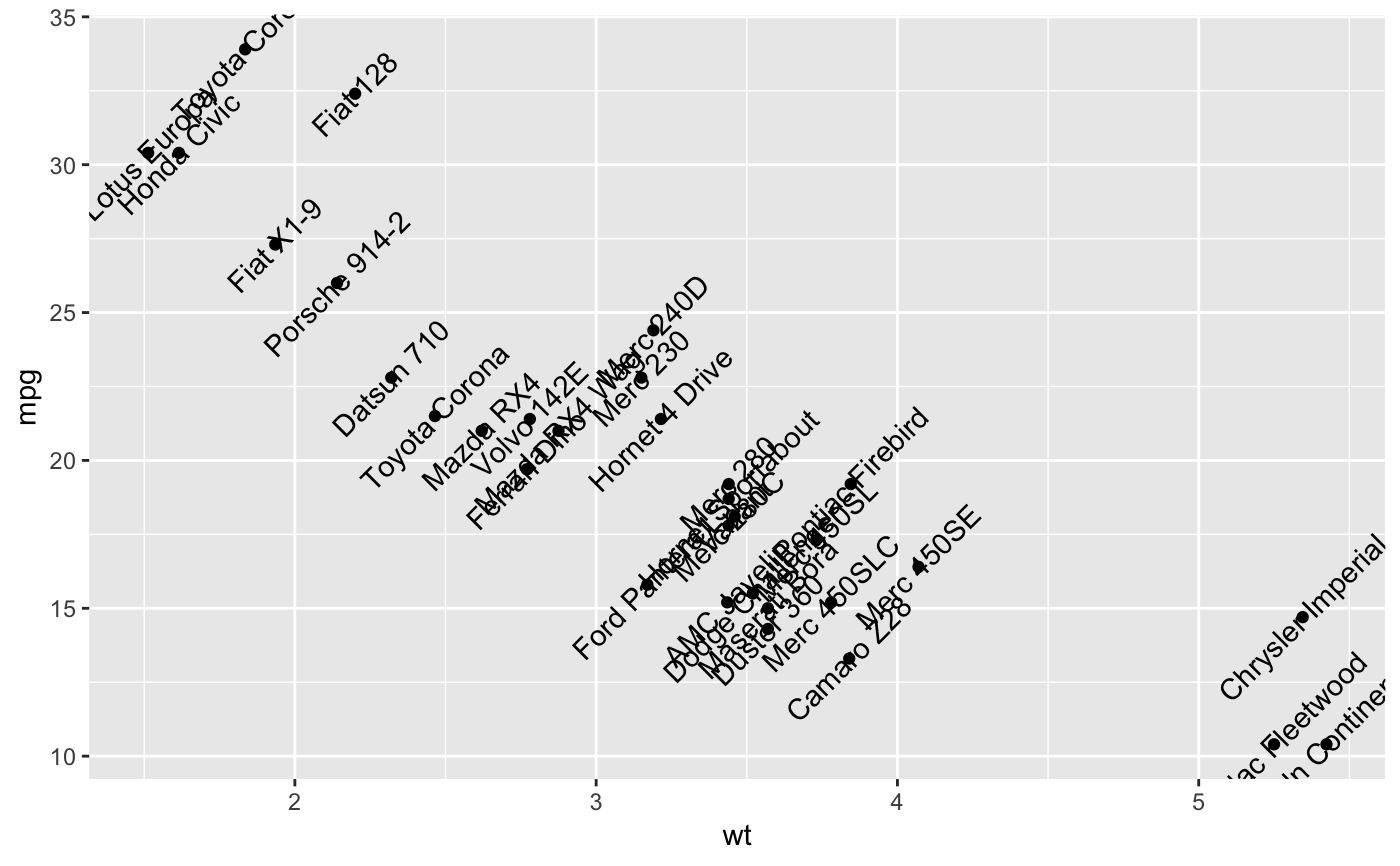
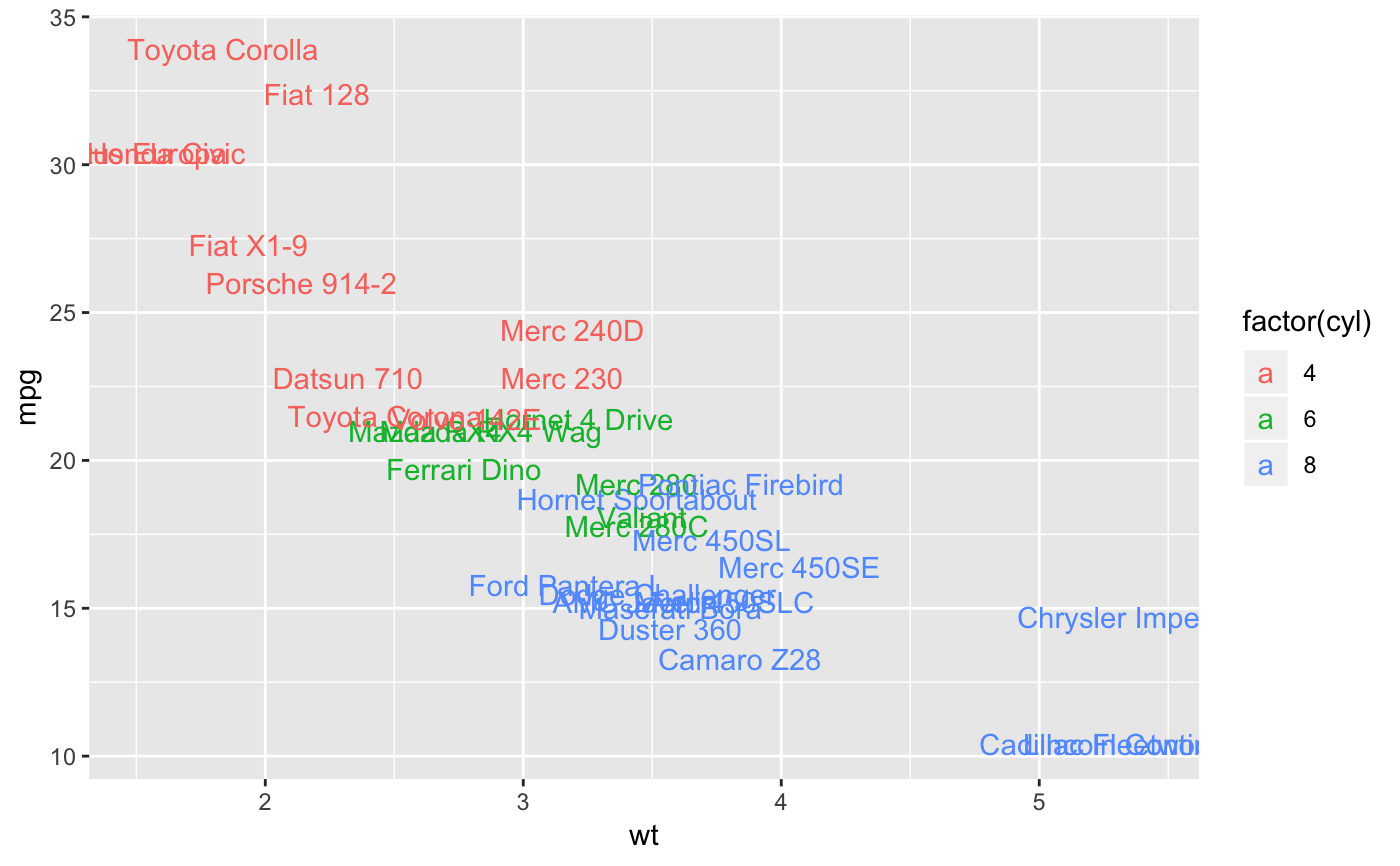
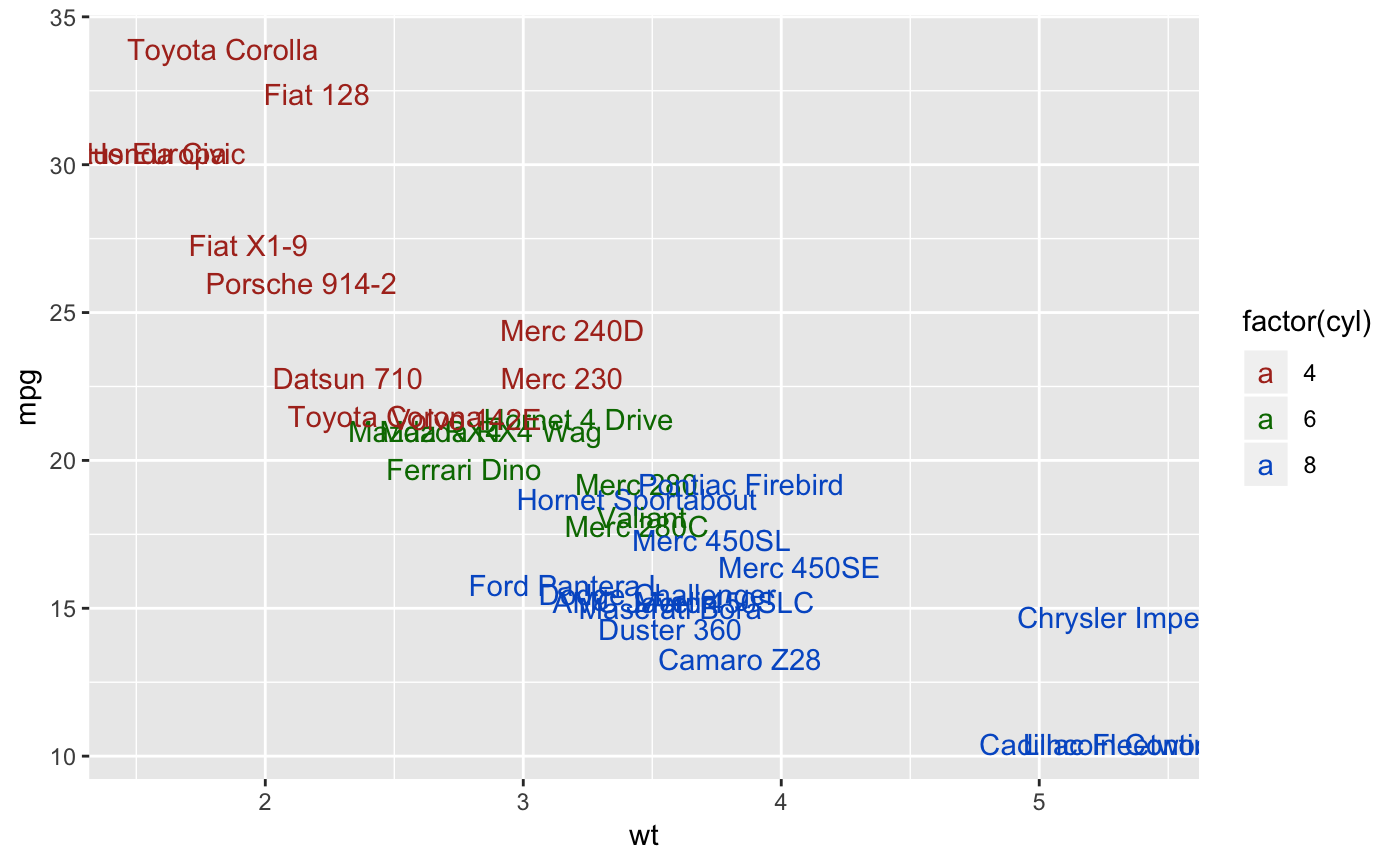
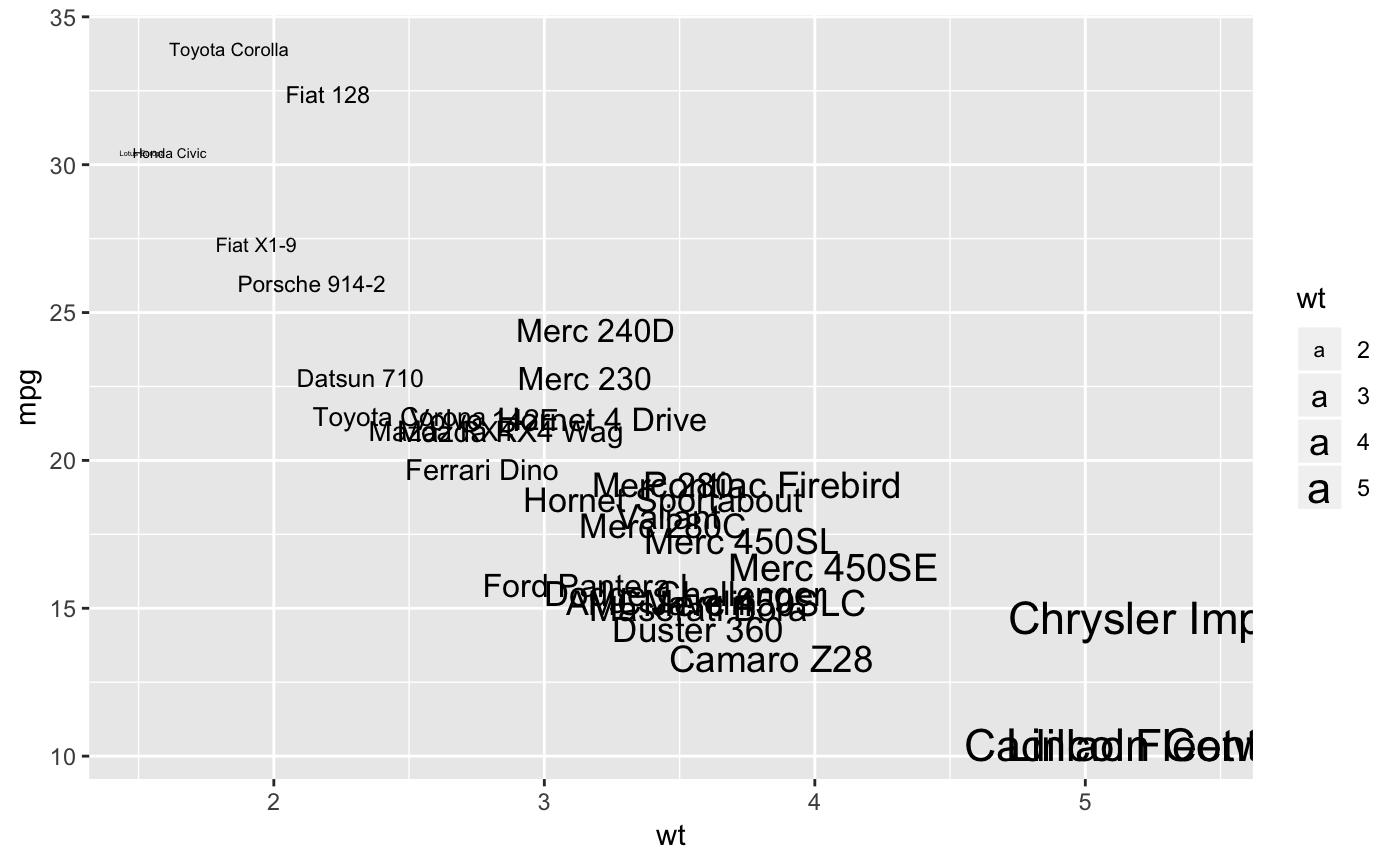
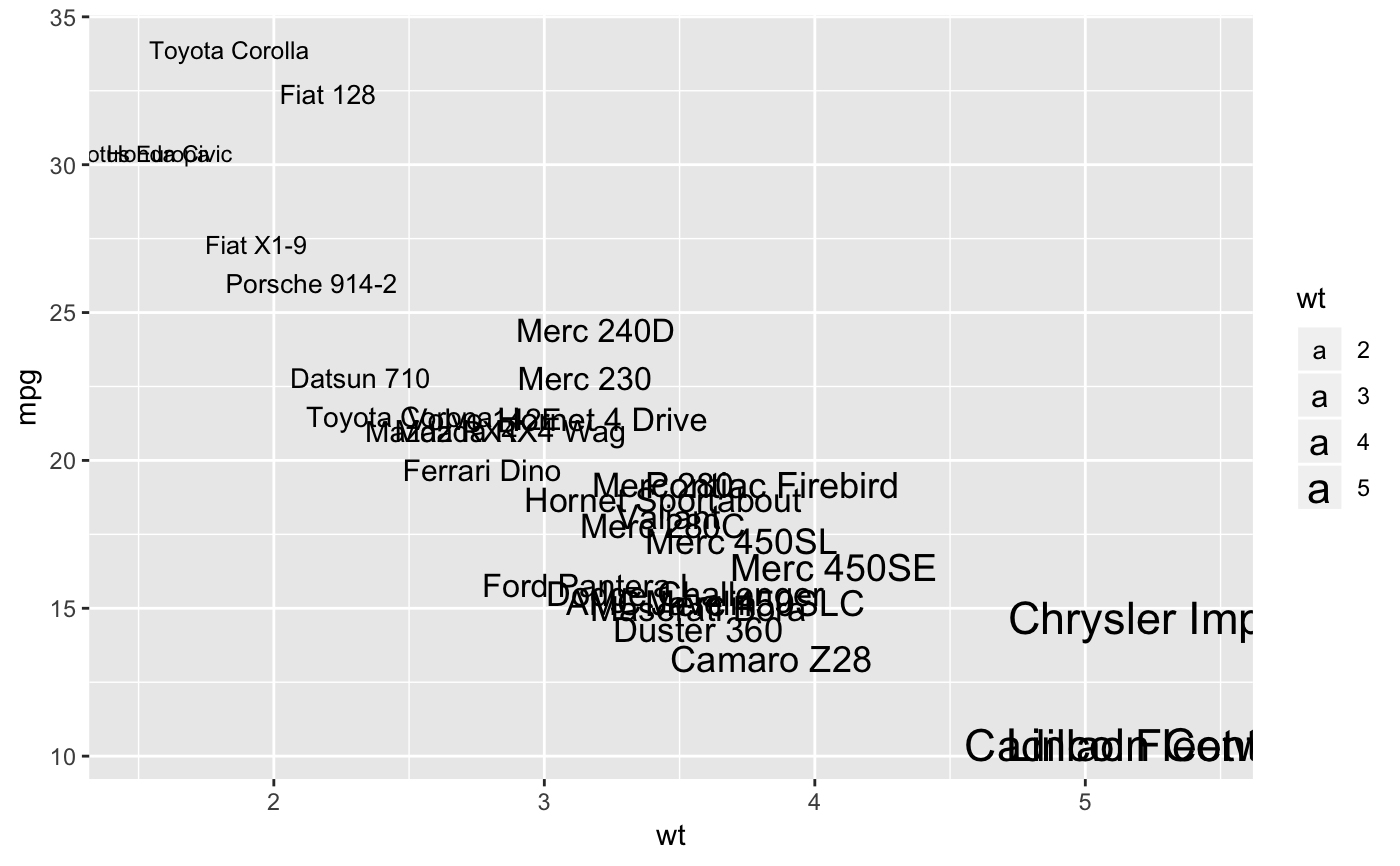
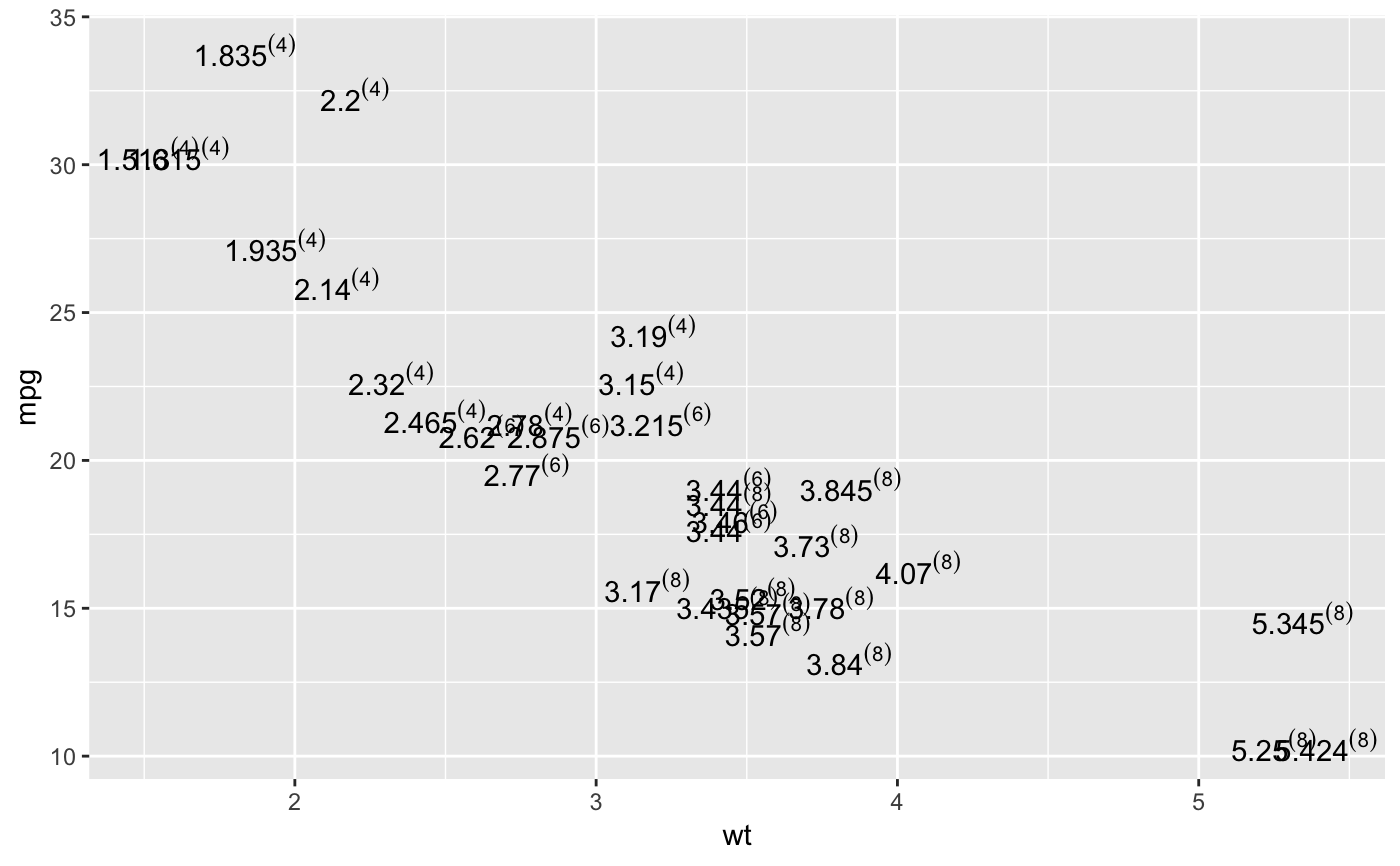
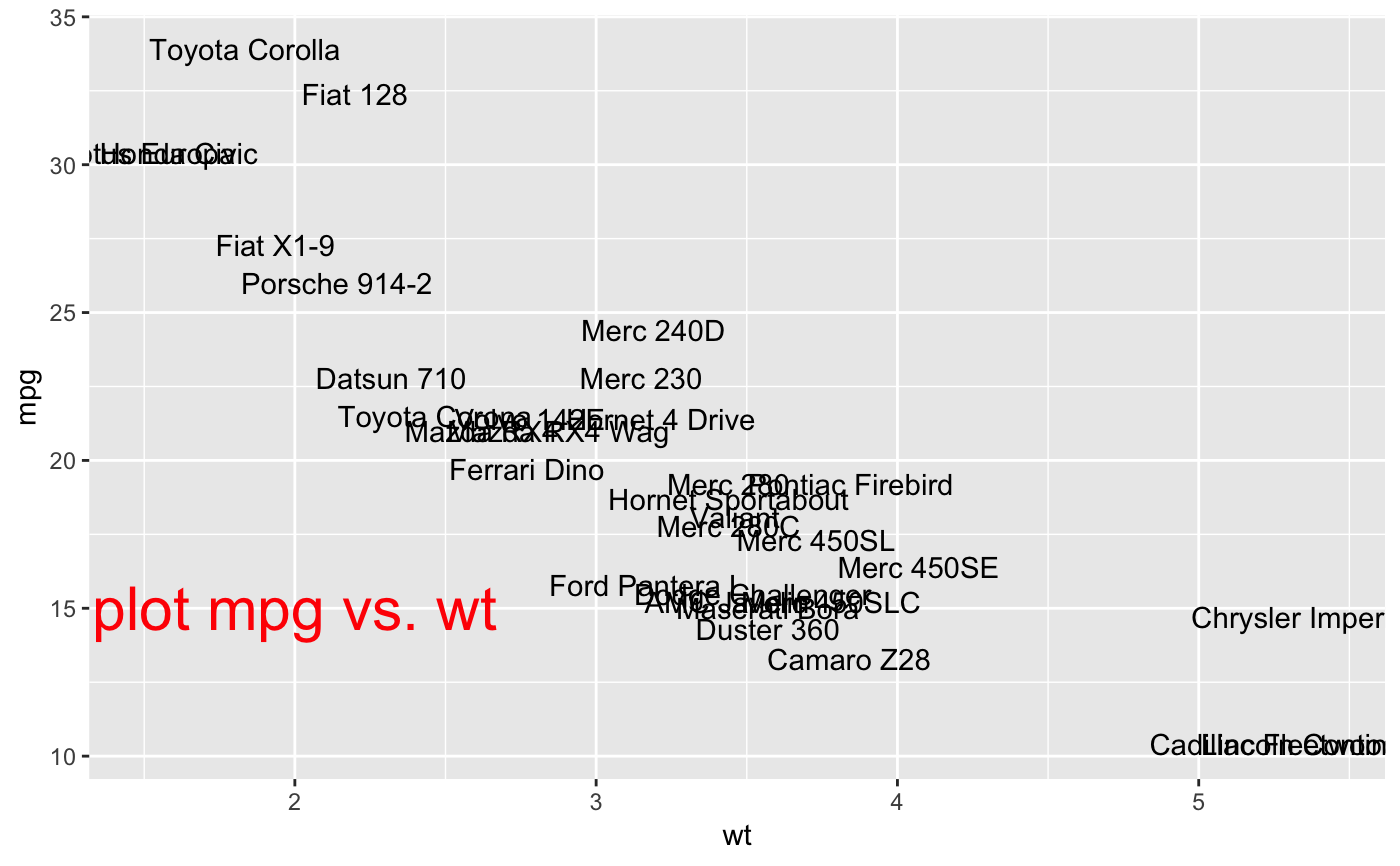
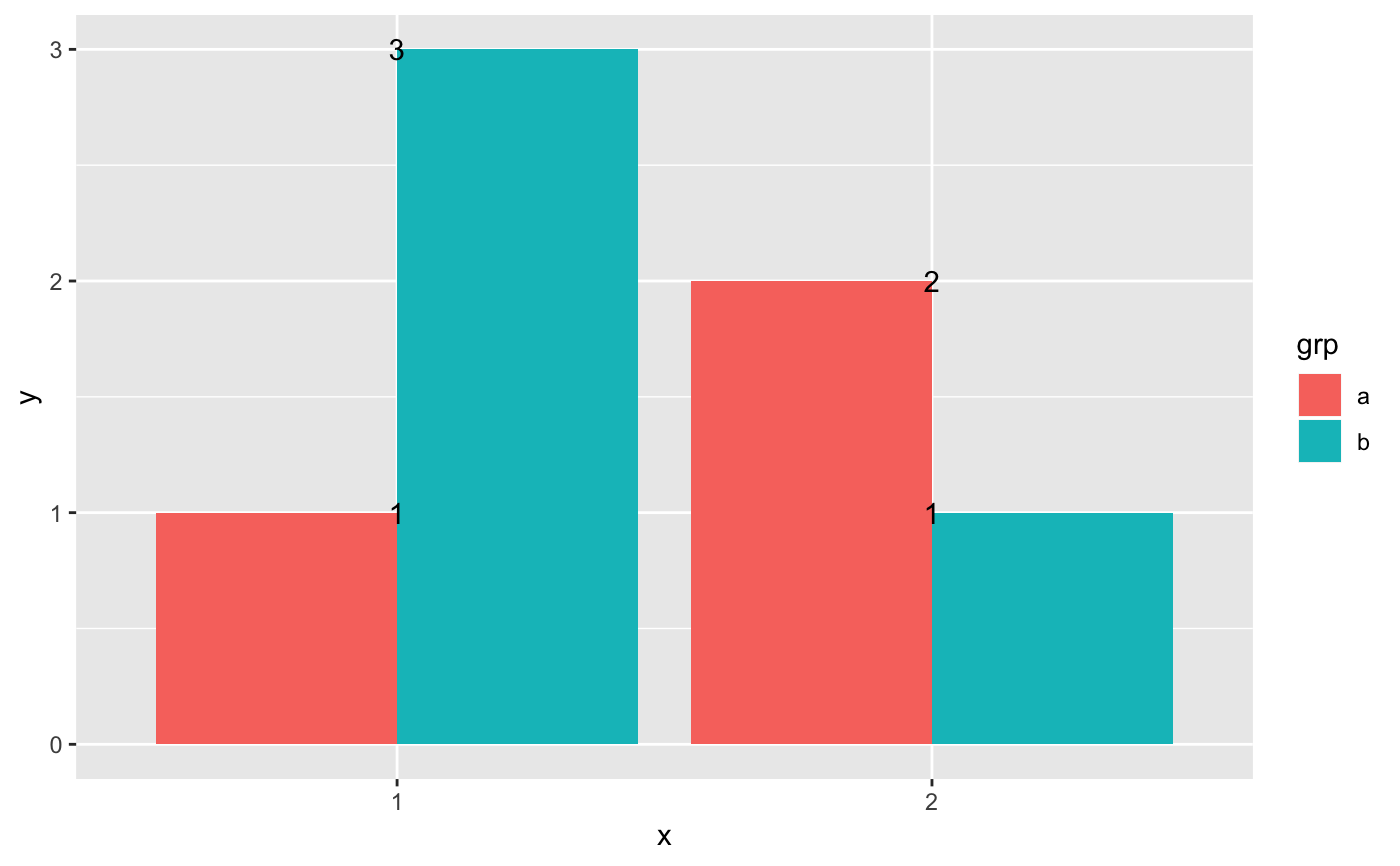
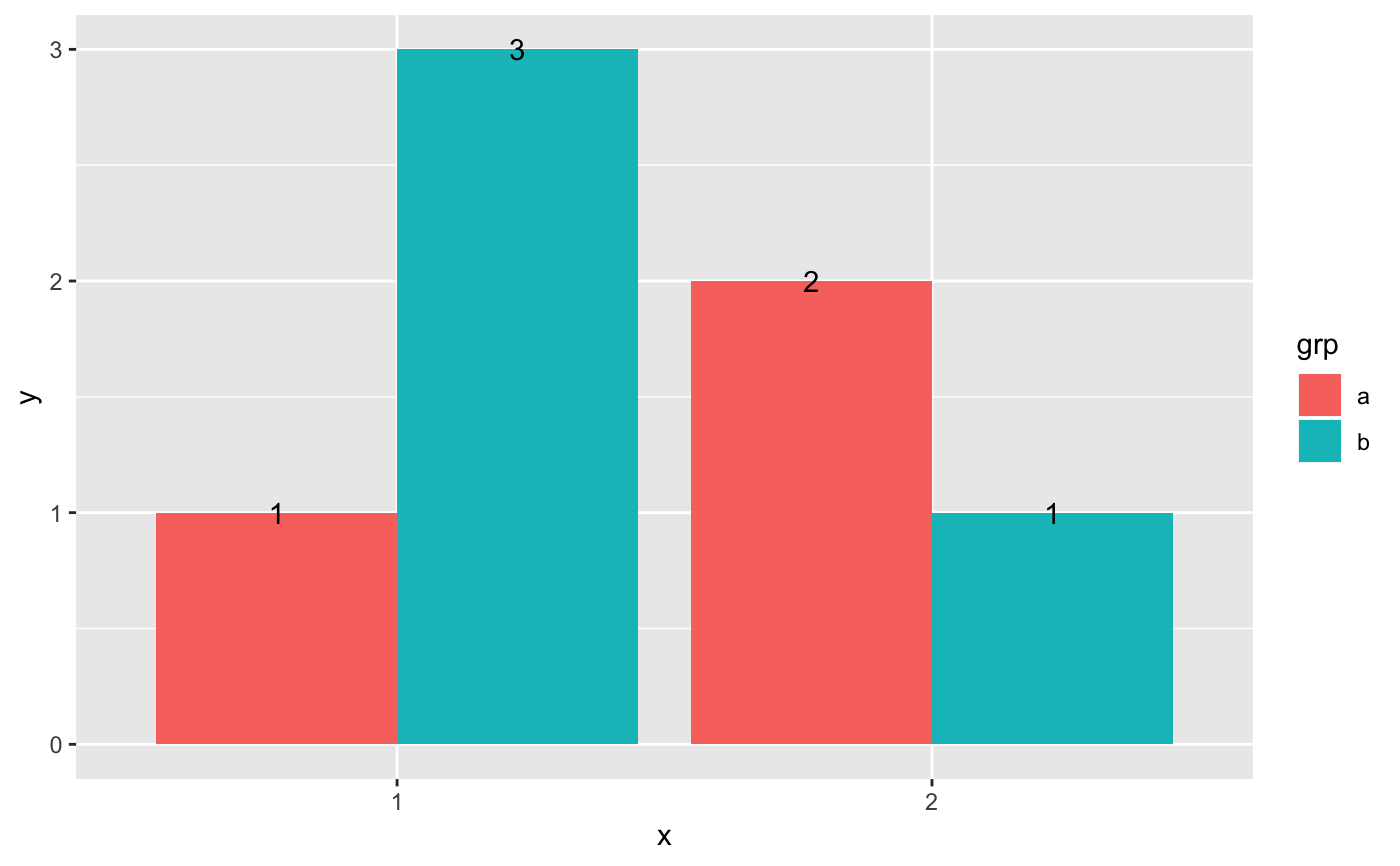
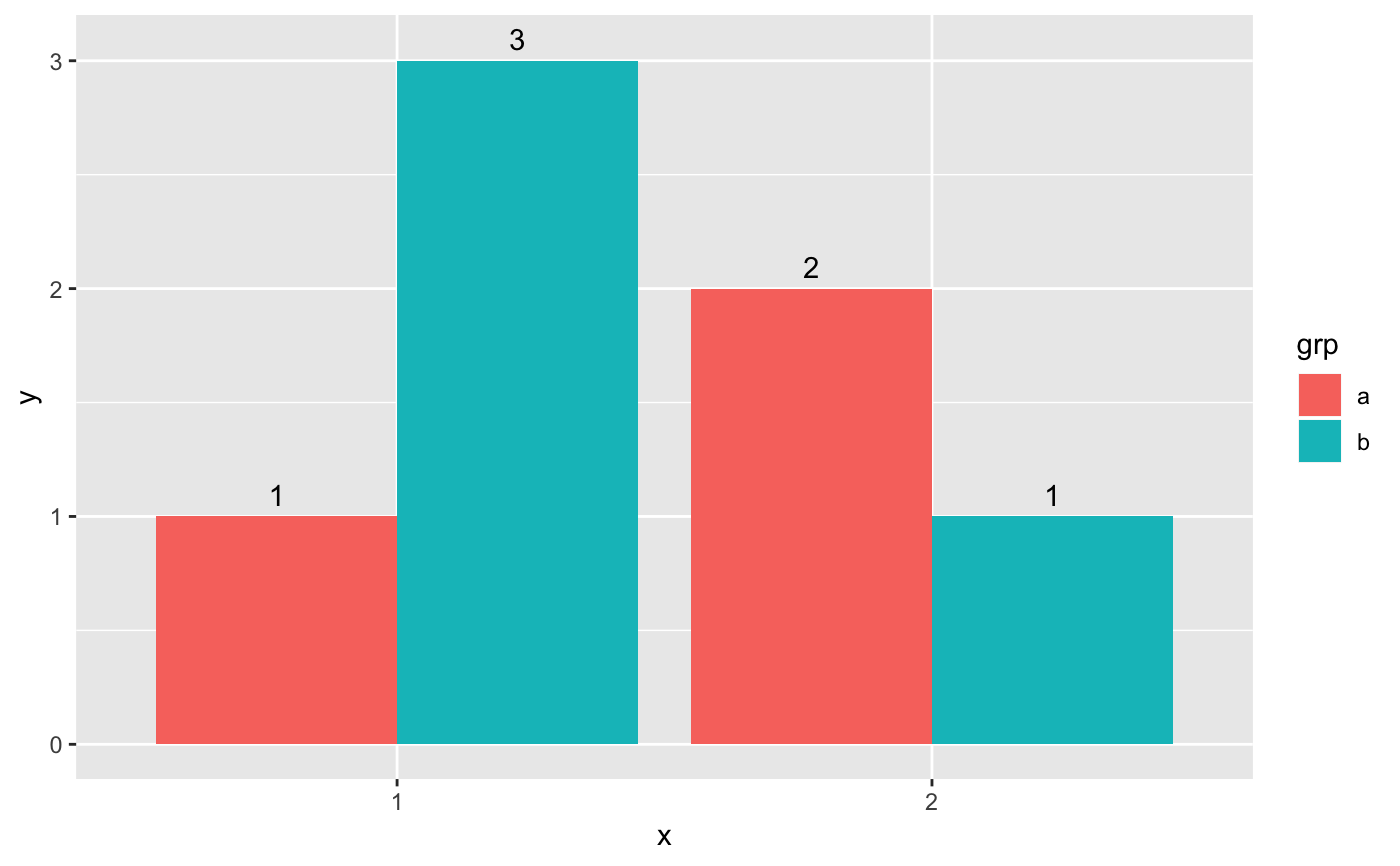
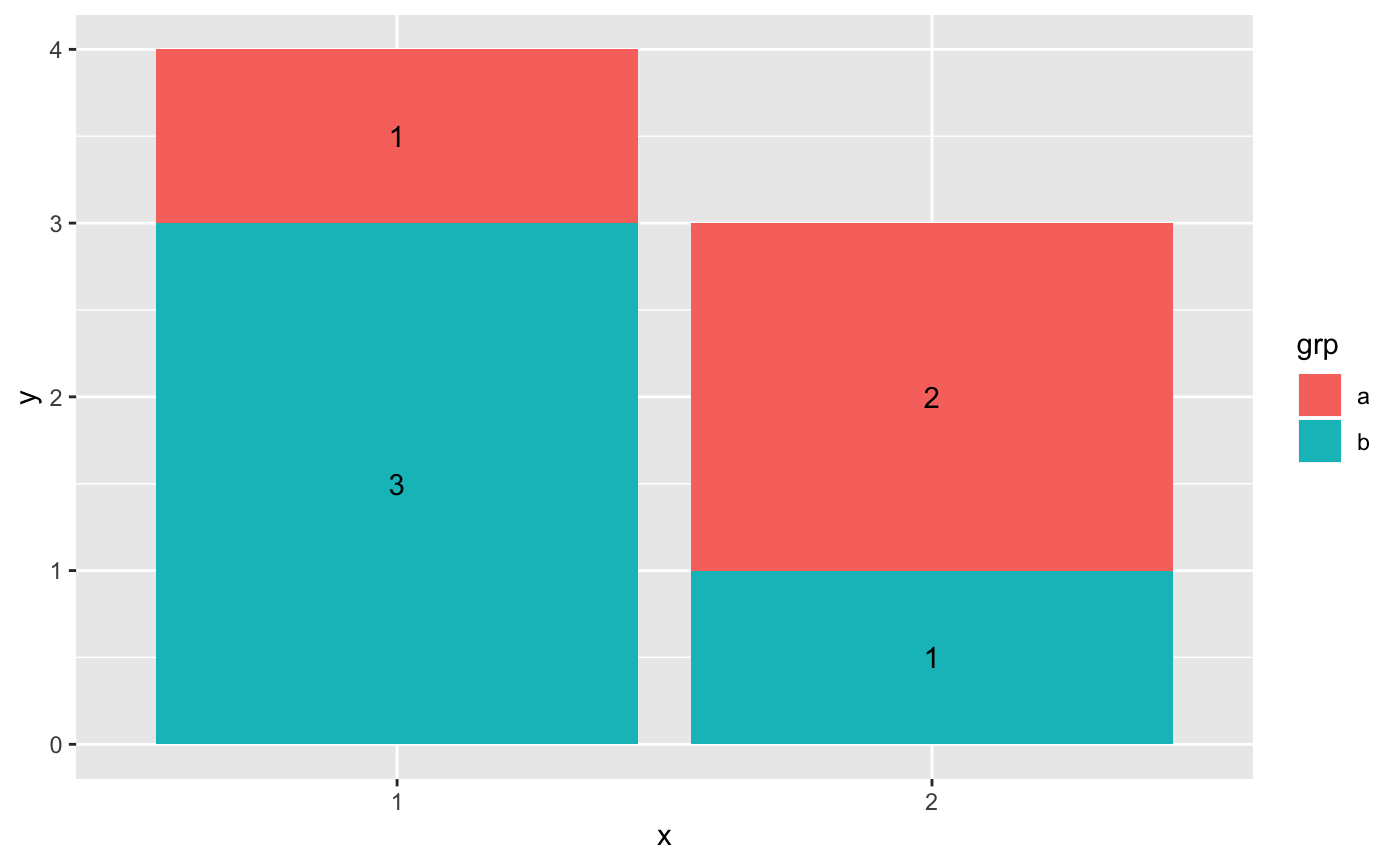
# Avoid overlaps p + geom_text(check_overlap = TRUE)# Labels with background p + geom_label()# Change size of the label p + geom_text(size = 10)# NOT RUN { # Doesn't work on all systems p + geom_text(family = "Times New Roman") # }# Scale height of text, rather than sqrt(height) p + geom_text(aes(size = wt)) + scale_radius(range = c(3,6))# You can display expressions by setting parse = TRUE. The # details of the display are described in ?plotmath, but note that # geom_text uses strings, not expressions. p + geom_text(aes(label = paste(wt, "^(", cyl, ")", sep = "")), parse = TRUE)# Add a text annotation p + geom_text() + annotate("text", label = "plot mpg vs. wt", x = 2, y = 15, size = 8, colour = "red")# Aligning labels and bars -------------------------------------------------- df <- data.frame( x = factor(c(1, 1, 2, 2)), y = c(1, 3, 2, 1), grp = c("a", "b", "a", "b") ) # ggplot2 doesn't know you want to give the labels the same virtual width # as the bars: ggplot(data = df, aes(x, y, group = grp)) + geom_col(aes(fill = grp), position = "dodge") + geom_text(aes(label = y), position = "dodge")#> Warning: Width not defined. Set with `position_dodge(width = ?)`# So tell it: ggplot(data = df, aes(x, y, group = grp)) + geom_col(aes(fill = grp), position = "dodge") + geom_text(aes(label = y), position = position_dodge(0.9))# Use you can't nudge and dodge text, so instead adjust the y postion ggplot(data = df, aes(x, y, group = grp)) + geom_col(aes(fill = grp), position = "dodge") + geom_text( aes(label = y, y = y + 0.05), position = position_dodge(0.9), vjust = 0 )# To place text in the middle of each bar in a stacked barplot, you # need to set the vjust parameter of position_stack() ggplot(data = df, aes(x, y, group = grp)) + geom_col(aes(fill = grp)) + geom_text(aes(label = y), position = position_stack(vjust = 0.5))# Justification ------------------------------------------------------------- df <- data.frame( x = c(1, 1, 2, 2, 1.5), y = c(1, 2, 1, 2, 1.5), text = c("bottom-left", "bottom-right", "top-left", "top-right", "center") ) ggplot(df, aes(x, y)) + geom_text(aes(label = text))
