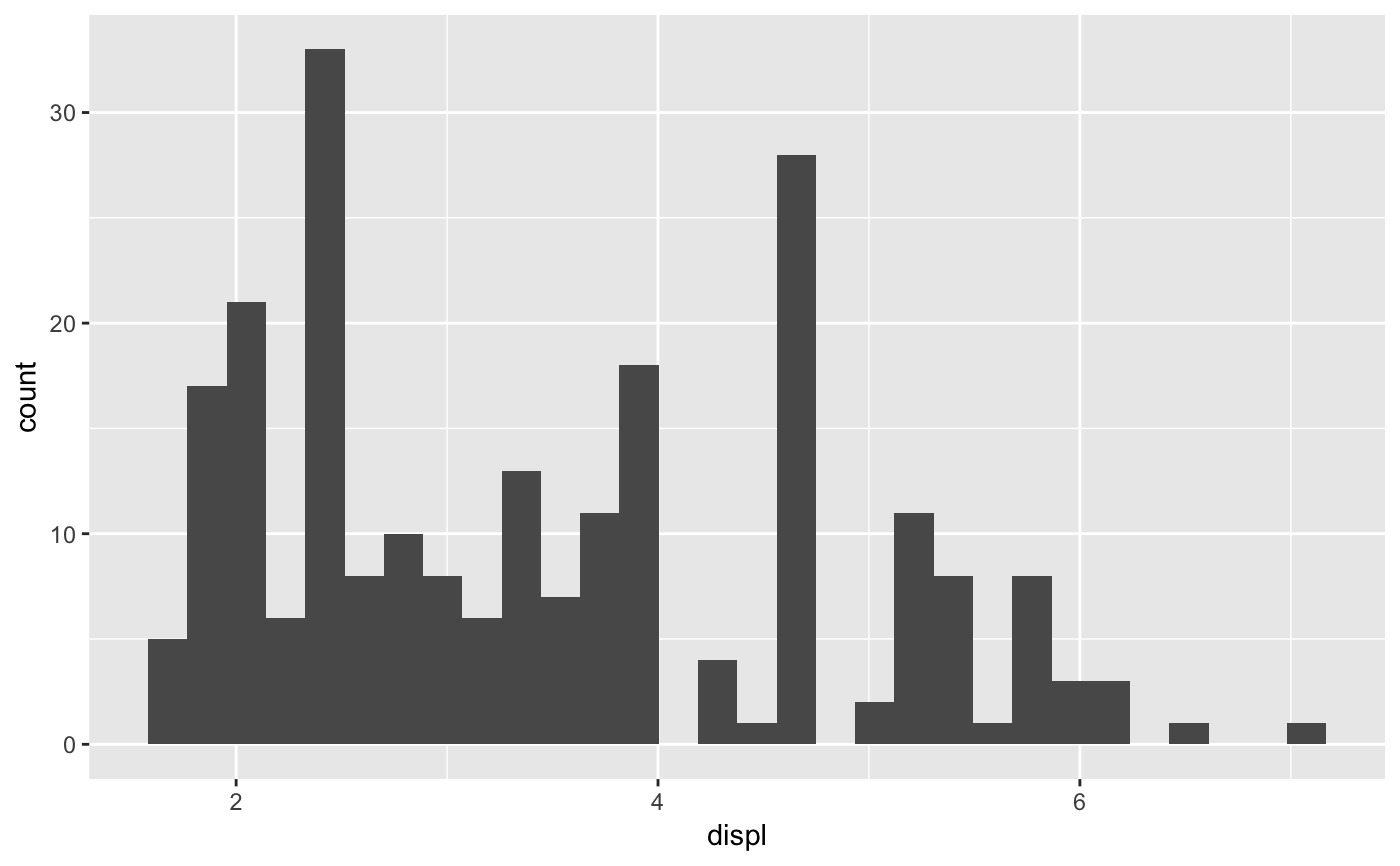
Most aesthetics are mapped from variables found in the data. Sometimes,
however, you want to map from variables computed by the aesthetic. The
most common example of this is the height of bars in geom_histogram():
the height does not come from a variable in the underlying data, but
is instead mapped to the count computed by stat_bin(). The stat()
function is a flag to ggplot2 to it that you want to use calculated
aesthetics produced by the statistic.
stat(x)
Arguments
| x | An aesthetic expression using variables calculated by the stat. |
|---|
Details
This replaces the older approach of surrounding the variable name with
...
Examples
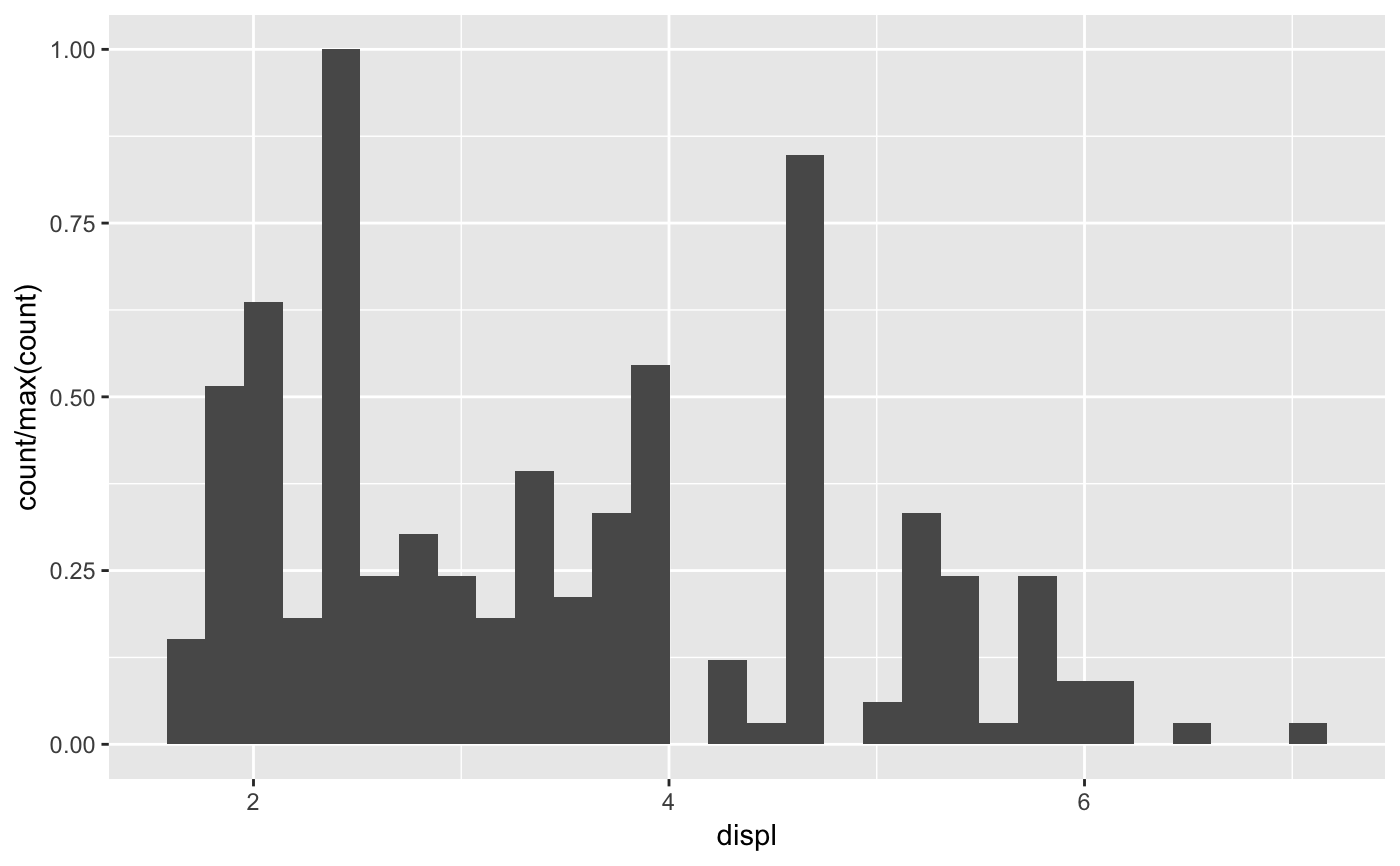
#># Scale tallest bin to 1 ggplot(mpg, aes(displ)) + geom_histogram(aes(y = stat(count / max(count))))#>

