This is a convenience function for generating scale expansion vectors
for the expand argument of
scale_*_continuous and
scale_*_discrete.
The expansions vectors are used to add some space between
the data and the axes.
expand_scale(mult = 0, add = 0)
Arguments
| mult | vector of multiplicative range expansion factors.
If length 1, both the lower and upper limits of the scale
are expanded outwards by |
|---|---|
| add | vector of additive range expansion constants.
If length 1, both the lower and upper limits of the scale
are expanded outwards by |
Examples
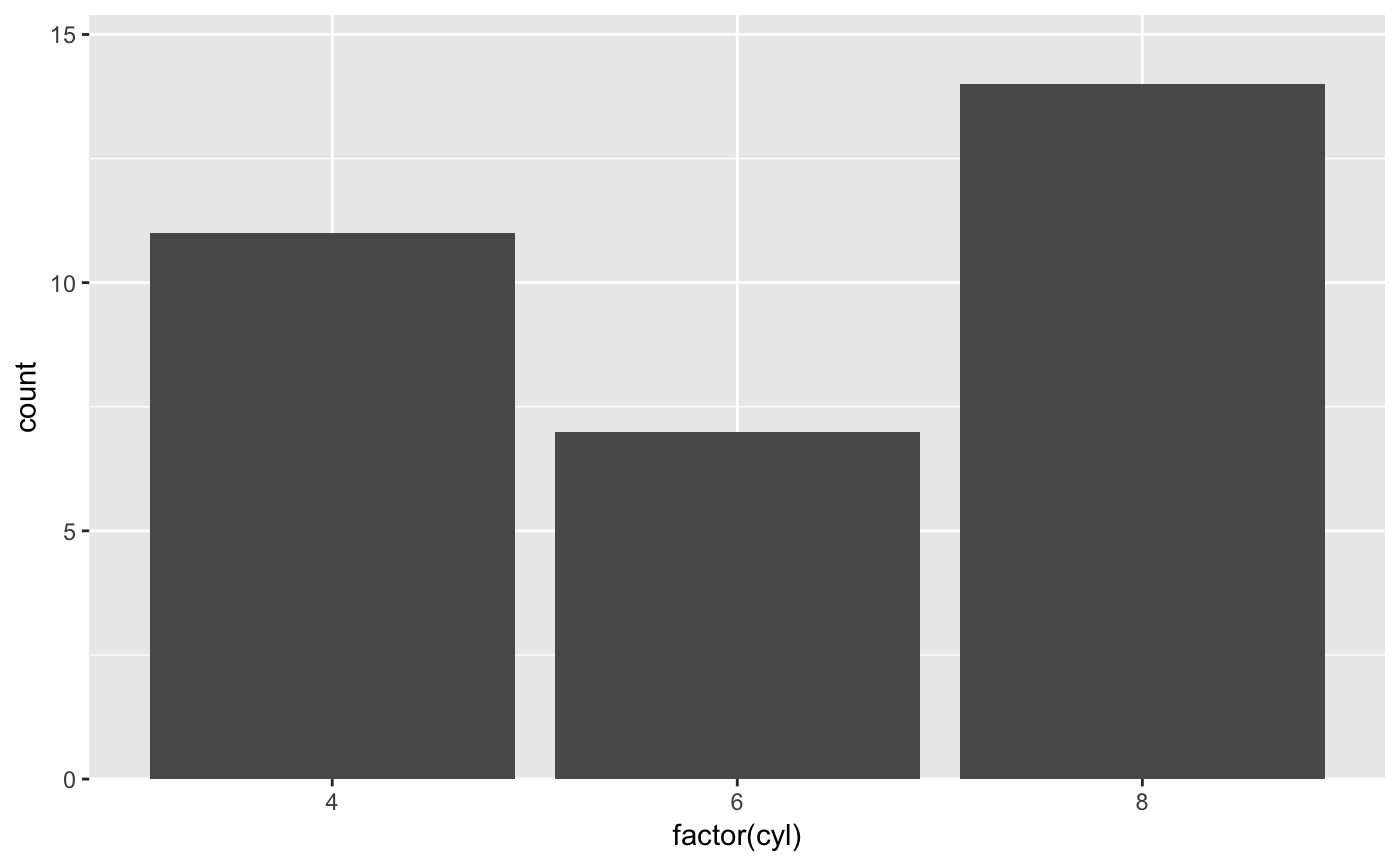
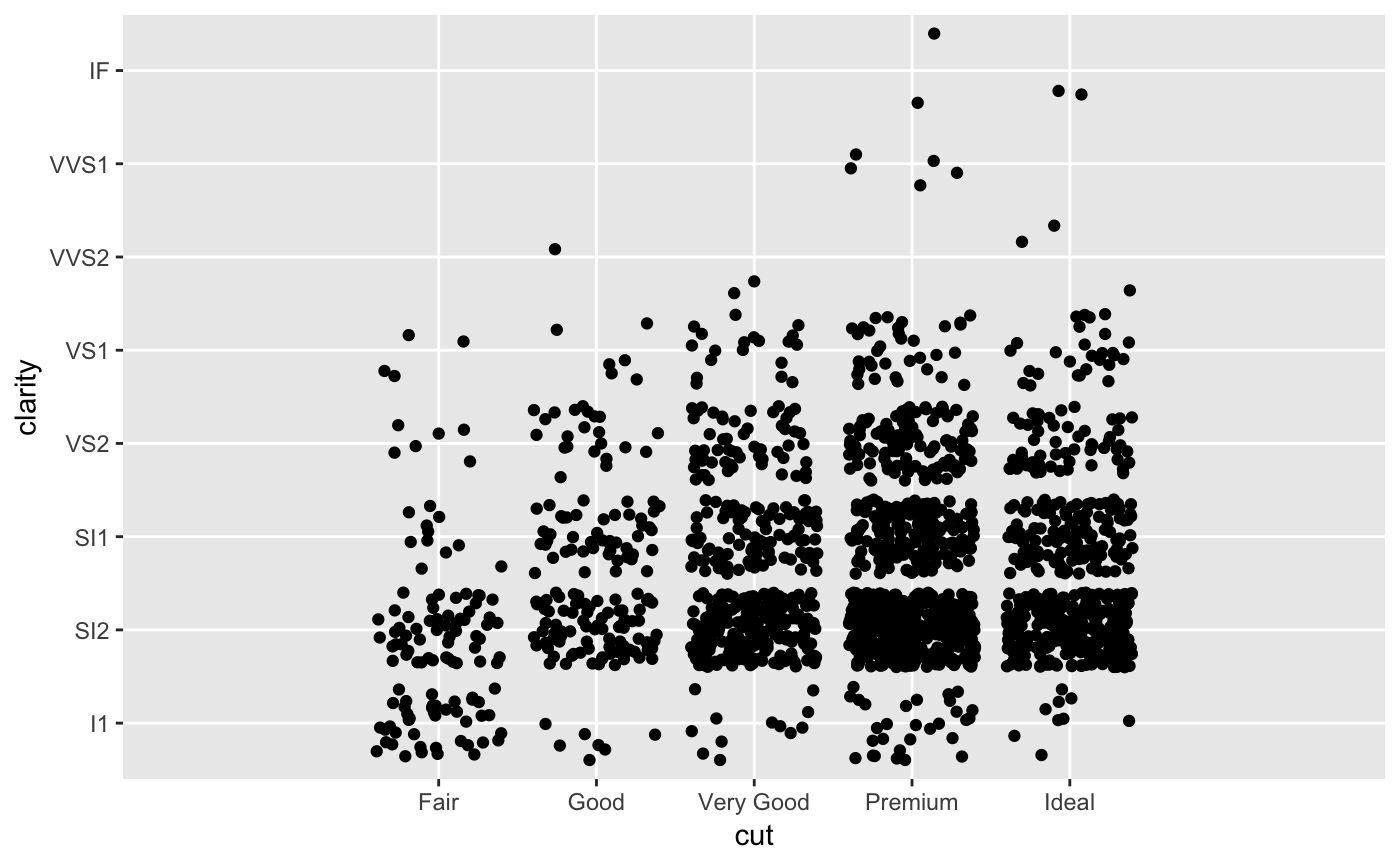
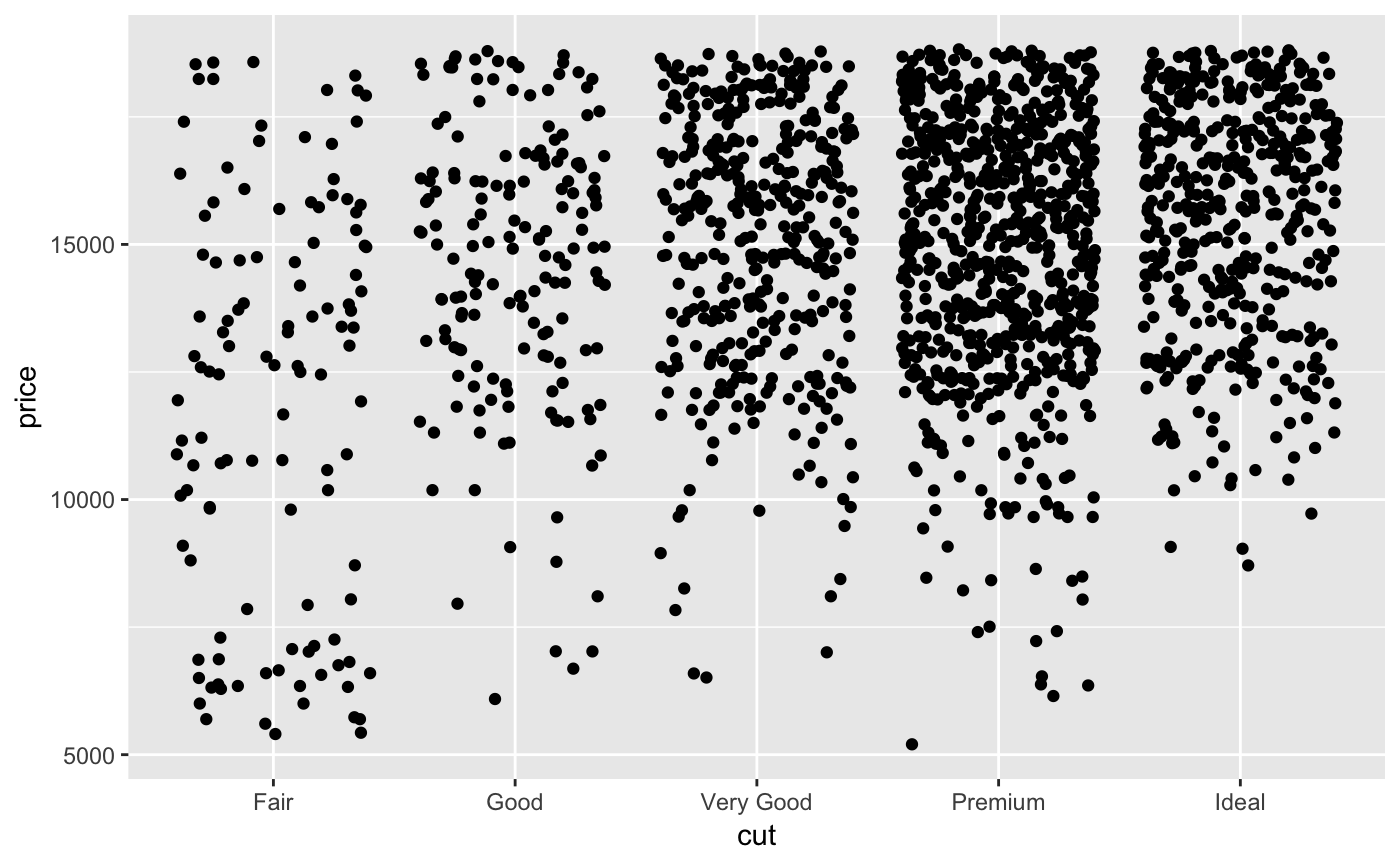
# No space below the bars but 10% above them ggplot(mtcars) + geom_bar(aes(x = factor(cyl))) + scale_y_continuous(expand = expand_scale(mult = c(0, .1)))# Add 2 units of space on the left and right of the data ggplot(subset(diamonds, carat > 2), aes(cut, clarity)) + geom_jitter() + scale_x_discrete(expand = expand_scale(add = 2))# Reproduce the default range expansion used # when the ‘expand’ argument is not specified ggplot(subset(diamonds, carat > 2), aes(cut, price)) + geom_jitter() + scale_x_discrete(expand = expand_scale(add = .6)) + scale_y_continuous(expand = expand_scale(mult = .05))