Contours of a 2d density estimate
Source:R/geom-density2d.r, R/stat-density-2d.r
geom_density_2d.RdPerform a 2D kernel density estimation using MASS::kde2d() and
display the results with contours. This can be useful for dealing with
overplotting. This is a 2d version of geom_density().
geom_density_2d(mapping = NULL, data = NULL, stat = "density2d",
  position = "identity", ..., lineend = "butt", linejoin = "round",
  linemitre = 10, na.rm = FALSE, show.legend = NA, inherit.aes = TRUE)

stat_density_2d(mapping = NULL, data = NULL, geom = "density_2d",
  position = "identity", ..., contour = TRUE, n = 100, h = NULL,
  na.rm = FALSE, show.legend = NA, inherit.aes = TRUE)
Arguments
| mapping | Set of aesthetic mappings created by |
|---|---|
| data | The data to be displayed in this layer. There are three options: If A A |
| position | Position adjustment, either as a string, or the result of a call to a position adjustment function. |
| ... | Other arguments passed on to |
| lineend | Line end style (round, butt, square). |
| linejoin | Line join style (round, mitre, bevel). |
| linemitre | Line mitre limit (number greater than 1). |
| na.rm | If |
| show.legend | logical. Should this layer be included in the legends?
|
| inherit.aes | If |
| geom, stat | Use to override the default connection between
|
| contour | If |
| n | number of grid points in each direction |
| h | Bandwidth (vector of length two). If |
Aesthetics
geom_density_2d understands the following aesthetics (required aesthetics are in bold):
xyalphacolourgrouplinetypesize
Learn more about setting these aesthetics in vignette("ggplot2-specs")
Computed variables
Same as stat_contour()
See also
geom_contour() for information about how contours
are drawn; geom_bin2d() for another way of dealing with
overplotting.
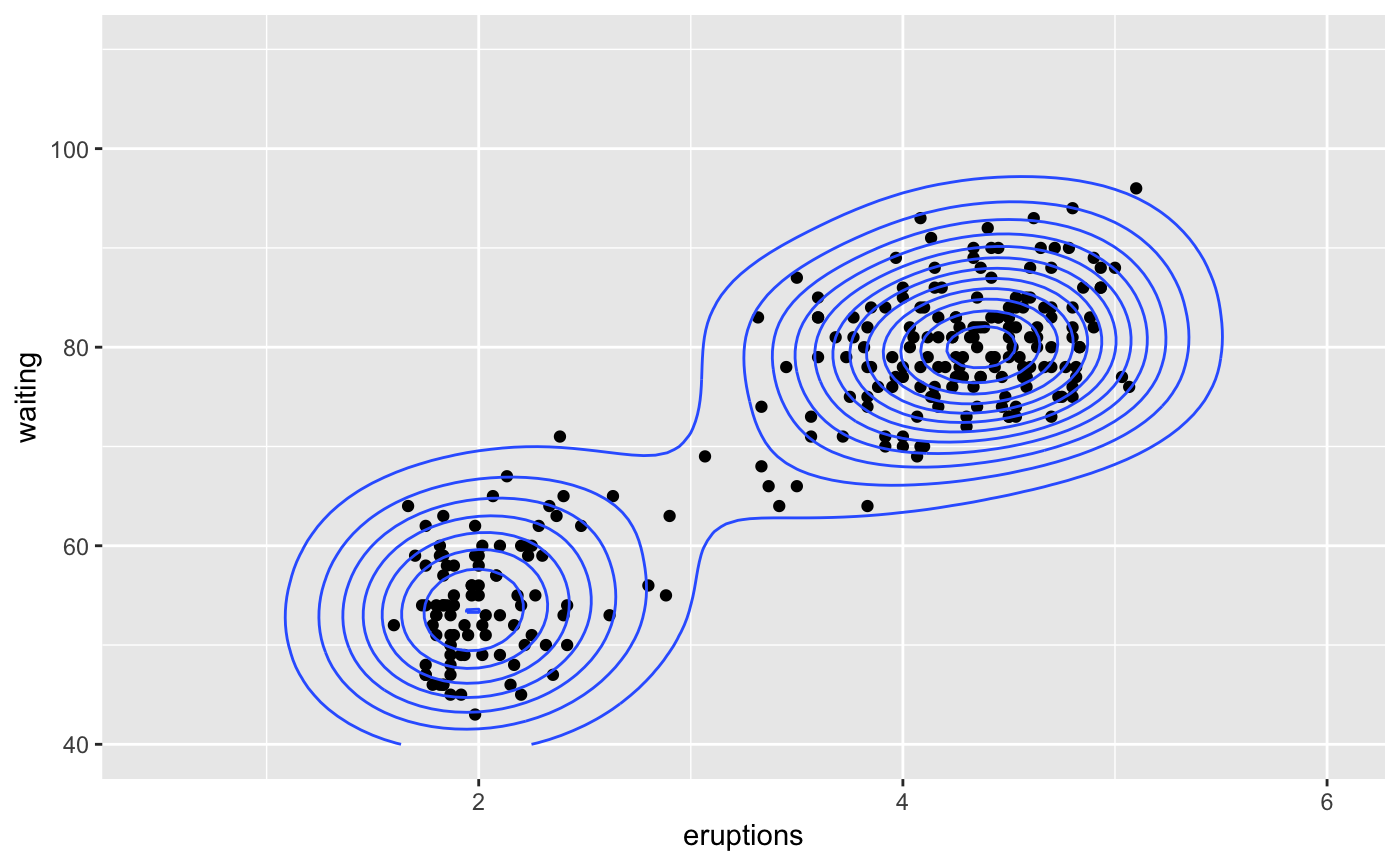
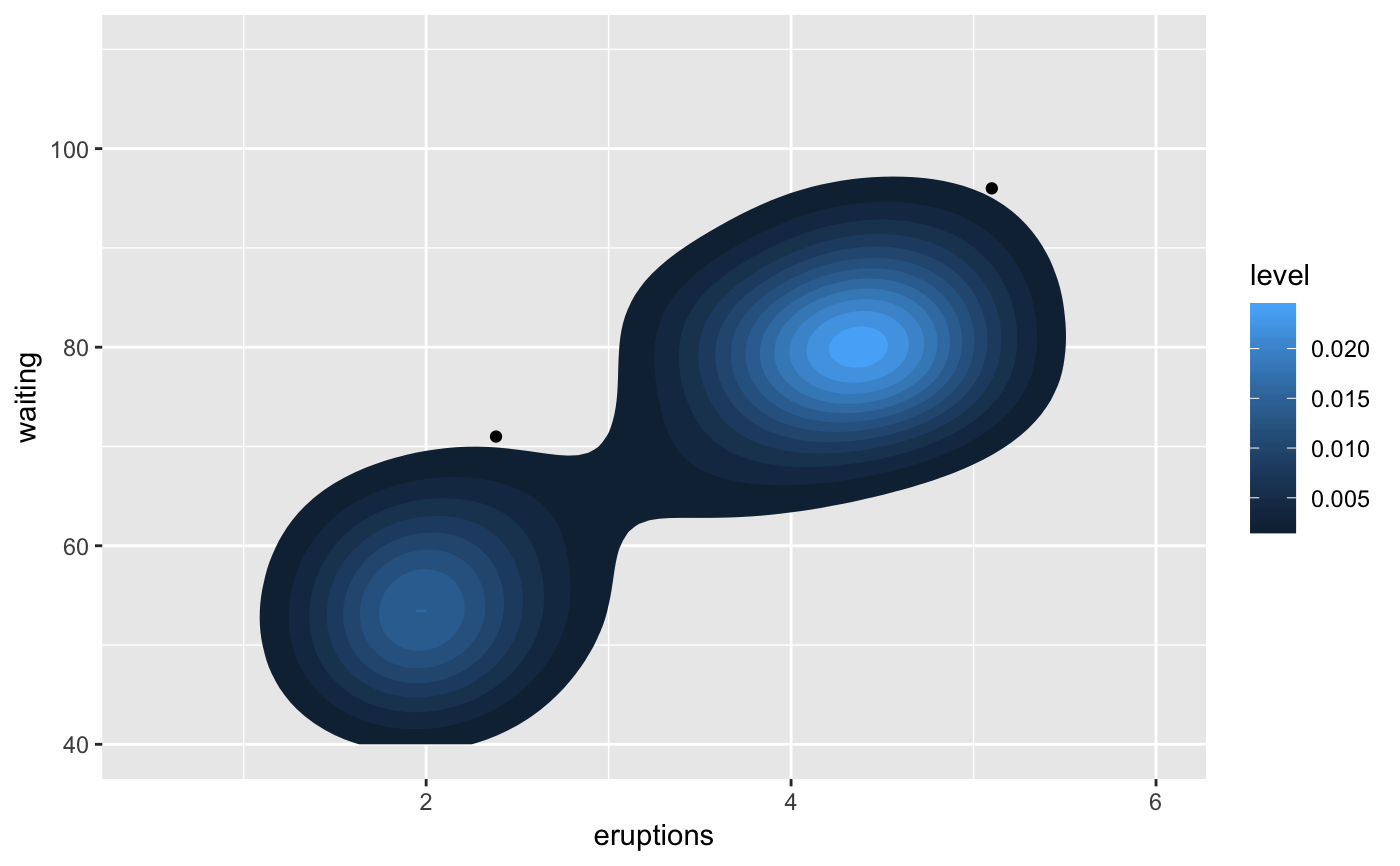
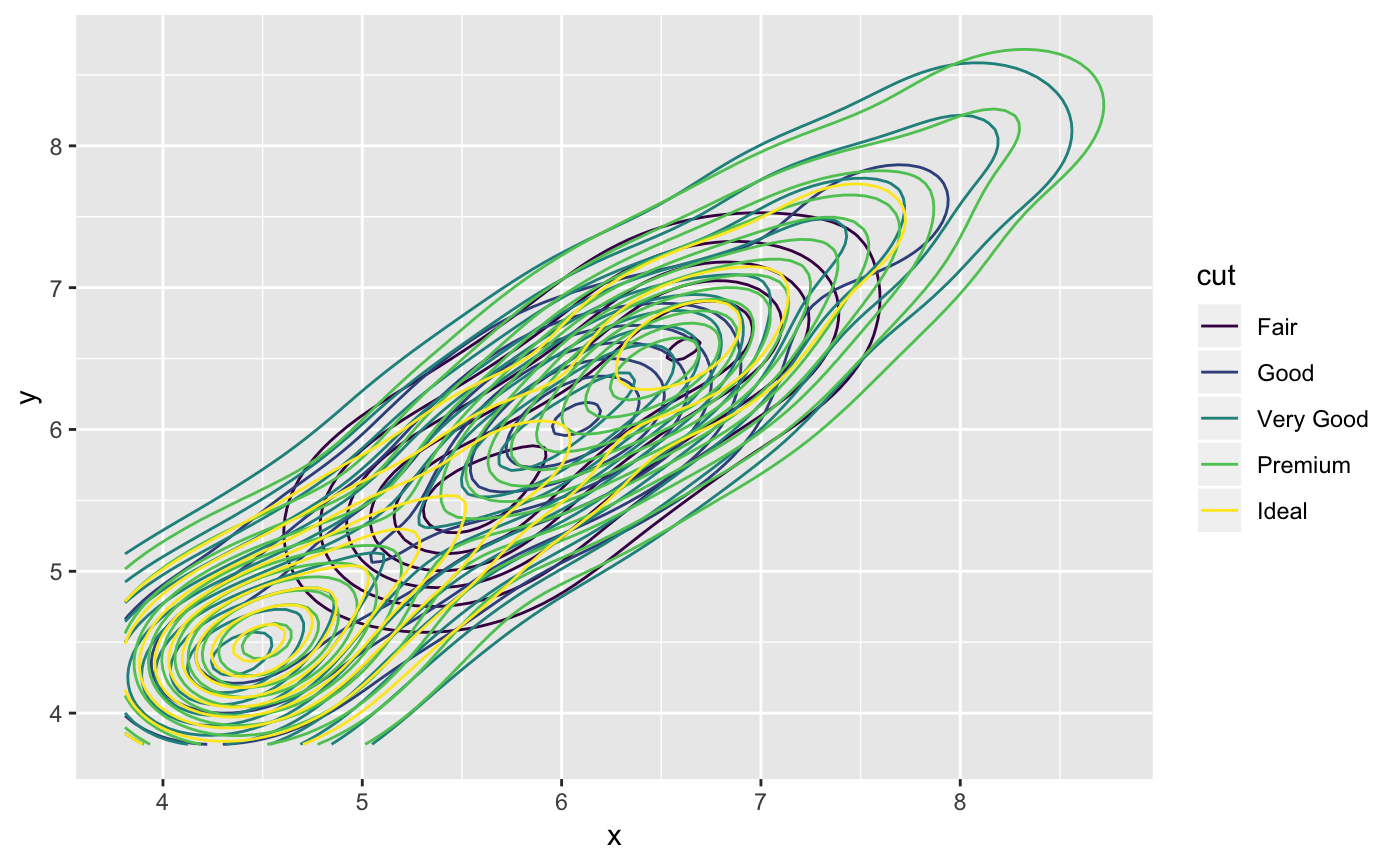
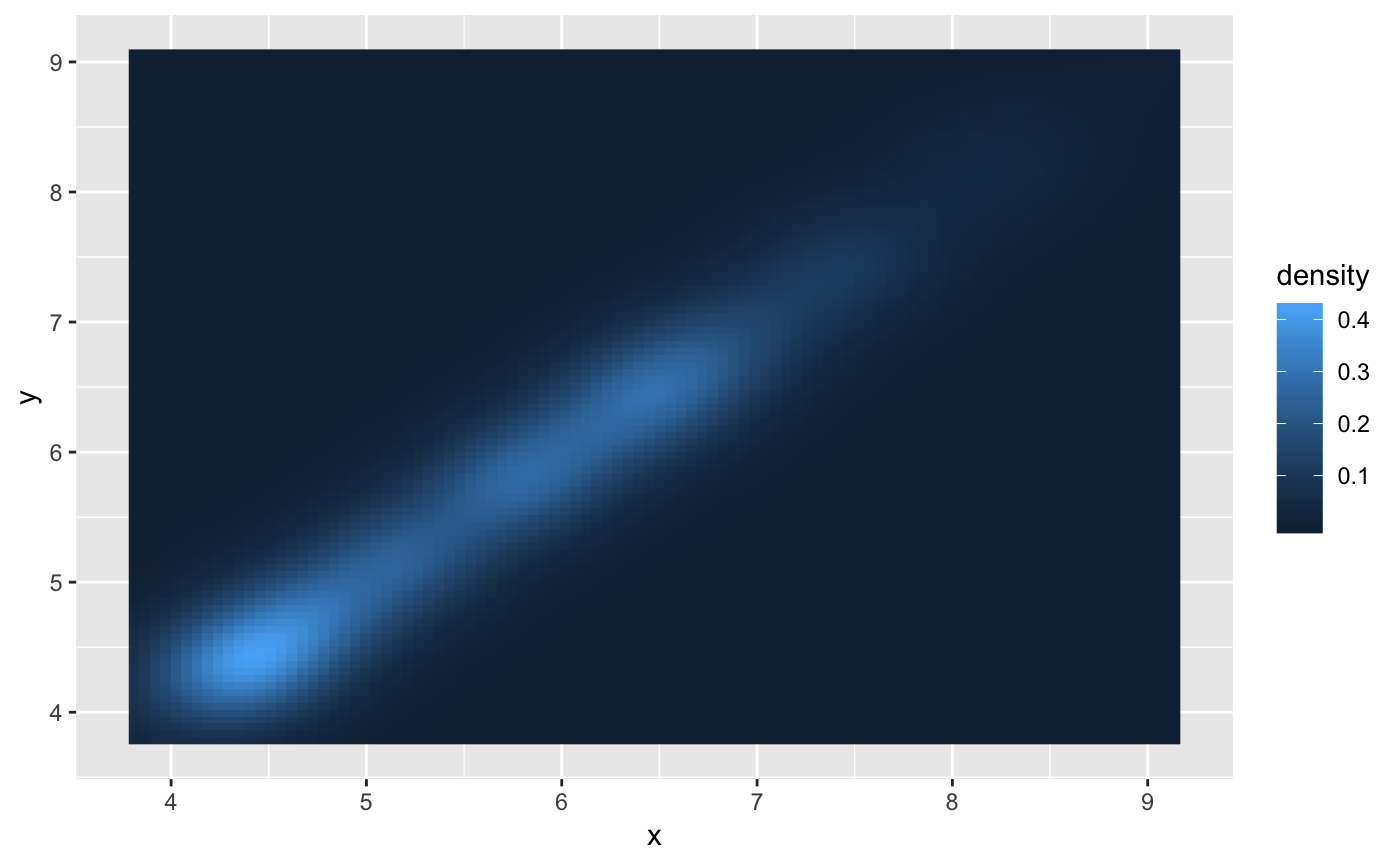
Examples
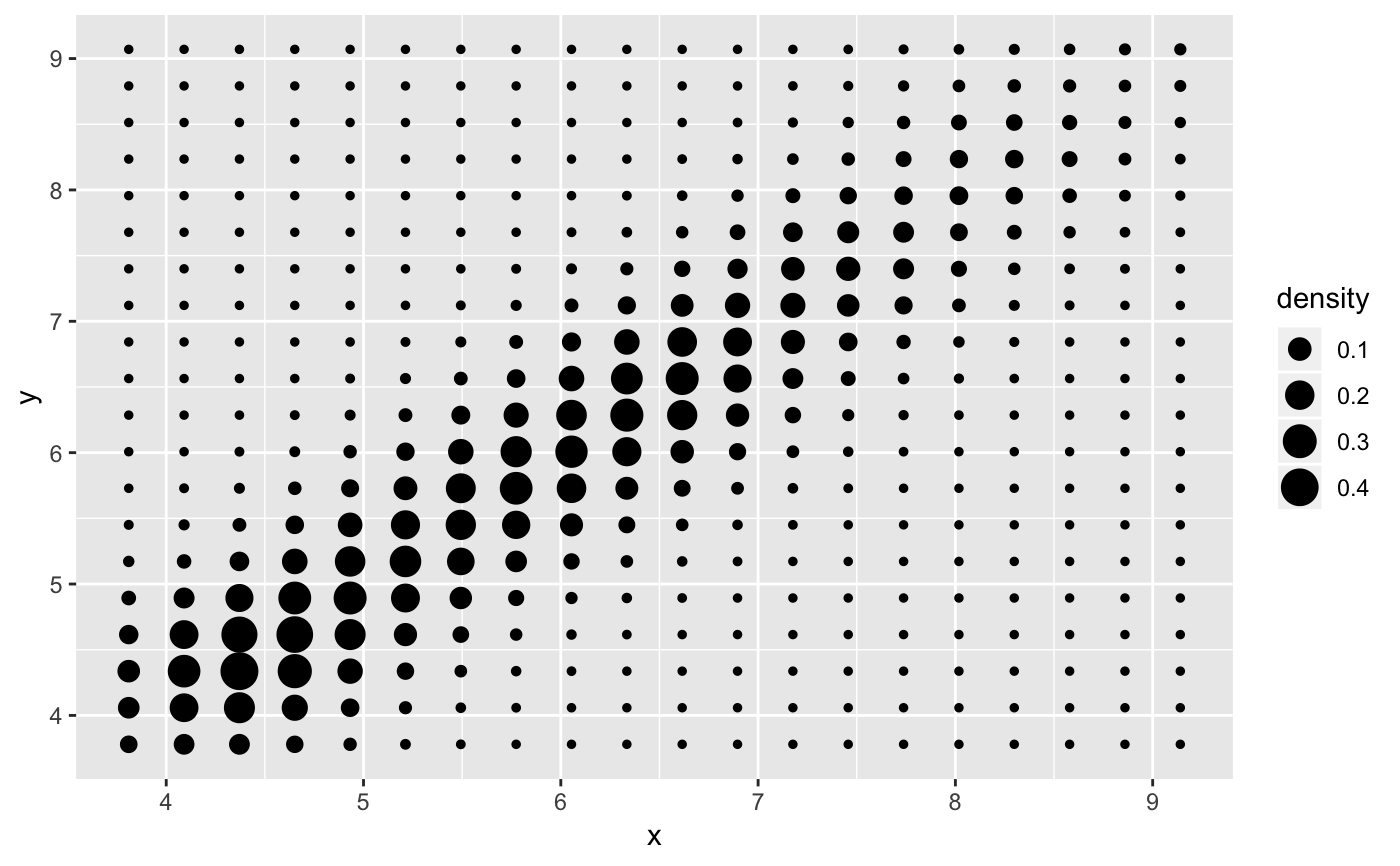
m <- ggplot(faithful, aes(x = eruptions, y = waiting)) + geom_point() + xlim(0.5, 6) + ylim(40, 110) m + geom_density_2d()set.seed(4393) dsmall <- diamonds[sample(nrow(diamonds), 1000), ] d <- ggplot(dsmall, aes(x, y)) # If you map an aesthetic to a categorical variable, you will get a # set of contours for each value of that variable d + geom_density_2d(aes(colour = cut))# If we turn contouring off, we can use use geoms like tiles: d + stat_density_2d(geom = "raster", aes(fill = stat(density)), contour = FALSE)# Or points: d + stat_density_2d(geom = "point", aes(size = stat(density)), n = 20, contour = FALSE)